


Transitioning Into Data Analytics from Non-Tech Backgrounds
Transitioning into data analytics from a non-tech background? Discover how to reskill, and build in-demand skills, and future-proof your career with Skillfloor.
Over 70% of people believe that data jobs are exclusively for engineers, which stops them from attempting. In reality, data analytics is no longer limited to mathematicians and programmers. These days, people from a wide range of industries—including marketing, finance, education, and commerce—are transitioning into data professions and succeeding greatly.
It's not necessary to have a technical background to begin this journey. You already have what it takes if you can think clearly, ask insightful questions, and are willing to learn gradually. This blog will walk you through the process of transitioning into data analytics, starting right where you are now.
What is Data Analytics?
The field of data analytics is not as challenging as it seems. You don't have to be an expert in math or code. It all comes down to examining data, understanding what it tells you, and applying that knowledge to make better decisions.
Here’s how it works in everyday terms:


-
You gather data (e.g., sales numbers)
-
You clean and summarize it
-
You answer questions like “Why did sales dip in July?”
-
You present insights that influence decisions
By applying data analytics techniques strategically, thinking logically, asking intelligent questions, and relating insights to actual business objectives and helpful decision-making procedures, professionals with non-tech backgrounds can achieve success.
Why Data Analytics Is Ideal for Career Switchers
There’s a powerful advantage for non-tech professionals:
-
Transferable Skills: In real-world analytics employment, your domain expertise, problem-solving skills, and business acumen become important assets.
-
Tools Over Coding: Many analytical tools reduce reliance on advanced programming skills by emphasizing logic and visual analysis.
-
High Demand Across Industries: Today, data-driven decision makers are essential in every industry, including marketing, finance, healthcare, operations, and education.
-
Better Salaries and Growth: Jobs in data analytics offer high compensation, quicker professional advancement, and long-term stability in a variety of industries.
-
Faster Entry Compared to Tech Roles: Instead of spending years learning intricate software engineering topics, you can become employable in a matter of months.
-
Business Impact-Driven Work: Your work directly affects performance, strategy, and decisions, increasing the significance and visibility of the position.
Compared to certain domains that necessitate intricate algorithms or deep coding, data analytics is about using numbers to tell stories, a skill that many professionals are already familiar with.
The Must-Have Skills to Start Your Data Analytics Journey
A tech degree is not necessary for success in data analytics, but developing the necessary skills will enable you to take advantage of greater chances more quickly.
-
Excel / Google Sheets: Spreadsheets will be used on a daily basis for data cleaning, trend analysis, report creation, and effective, fast, and business-friendly analysis.
-
SQL (Structured Query Language): SQL is crucial for real-world data analysis tasks because it allows you to extract, filter, join, and work with big datasets from databases.
-
Data Visualization (Power BI / Tableau): Using visualization tools, you can turn complicated data into understandable dashboards and stories that decision-makers can act upon.
-
Basic Statistics: Making solid, data-driven business decisions is made possible by the understanding of patterns, trends, correlations, and probabilities that statistics provides.
-
Business & Analytical Thinking: This skill enables you to pose pertinent queries, acquire insightful information, and relate data findings to actual business objectives.
-
Communication & Storytelling with Data: In order for non-technical stakeholders to comprehend and trust decisions, you must clearly communicate insights using simple language, illustrations, and stories.
Your Step-by-Step Roadmap to Data Analytics
Let’s break it down into clear phases so you always know what’s next.
1. Understand What Data Analytics Really Means
It's crucial to understand what data analytics actually entails and why it's significant for your professional development before diving into courses and certifications.
The process of gathering, cleaning, and analyzing data through structured learning—including online and offline data analytics courses—in order to find insights that facilitate more intelligent, self-assured decision-making is known as data analytics.
At its core, data analytics is simply:
-
Asking the right questions

-
Finding answers using data
-
Helping others make informed decisions


There are typically four types of analytics:
-
Descriptive: What happened
-
Diagnostic: Why it happened
-
Predictive: What might happen
-
Prescriptive: What should be done
Starting with descriptive analytics in Excel is already a solid, useful first step; the principles remain the same, only the domain changes.
2. Identify Your Transferable Skills
Here are several skills that you most likely already possess, along with an explanation of how they naturally relate to data analytics:
-
If you are in the marketing industry, you already examine consumer behavior and campaign results. That is the use of analytics.
-
HR professionals deal with employee data, engagement measures, and attrition patterns. That is also analytics.
-
If you work in operations, you keep an eye on workflows, processes, and productivity. Practical analytics in action.
You have a lot of experience already, so you're not starting from scratch. Even if you never call it data analytics, analysis is a part of every job.
3. Choose the Right Learning Path
Start with the basics and go from there. It's not necessary to learn everything at once; learning gets easier when it's organized and targeted.
Essential Tools to Learn:
-
Excel or Google Sheets: The foundation of daily analysis and most data-related jobs
-
SQL: Used to manage, retrieve, and filter data kept in databases
-
Power BI or Tableau: Assists in transforming data into lucid dashboards and insightful narratives
-
Python (optional): Helpful for handling bigger, more complicated datasets or automating processes
A Practical Learning Roadmap:
-
Start with Excel: To establish a solid basis, learn formulas, pivot tables, and simple charts.
-
Move to SQL: Practice extracting and arranging information from databases.
-
Add a BI tool: Make visual reports and dashboards to effectively convey insights.
-
Work on projects: Analyze subjects linked to your interests or experience using publicly available datasets to gain practical confidence.
You can take free/affordable courses from places like:
Coursera
YouTube
Kaggle (for datasets and projects)
TripleTen (job-ready bootcamp)
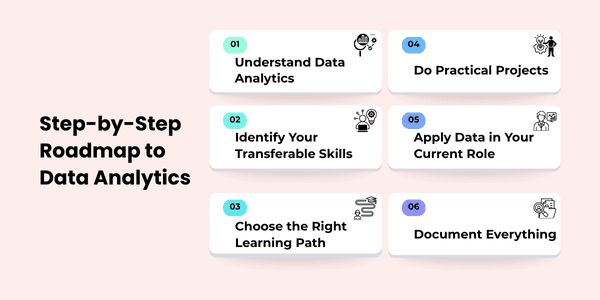
4. Do Practical Projects Early
Use genuine datasets that represent your interests or background to apply what you've learned. Create initiatives that show business value in place of generic exercises:
- A sales or student performance dashboard.
- Analysis of trends in your former field.
- Visual representations of operational trends.
Projects speed up your learning and provide recruiters with tangible proof of your abilities.
5. Apply Data in Your Current Role
It's okay if some people aren't ready to change careers right now.
You can start using data skills in your existing position.
Ask yourself:
-
“What metrics or reports do I already handle?”
-
“Can I analyze or present this information more effectively?”
-
“Could I use Excel or Power BI to automate tasks or create visual insights?”
By doing this, you improve your portfolio, boost your confidence in your data skills, and become more visible at work.
6. Document Everything
Building trust involves keeping track of what you developed, why you built it, and the methods, insights, and tools you employed. To increase visibility and confidence, post your work on Medium, LinkedIn, or a portfolio.
What You Really Need Vs. What You Can Ignore
Many students spend time trying to learn everything. This is what really matters:
Need to Learn
-
Data cleaning & transformation
-
SQL querying
-
Data visualization
-
Interpretation & business insight
Not Necessary at Start
-
Advanced programming
-
Deep math beyond basics
-
Complex machine learning
-
Overloading on Multiple Tools
How to Learn Effectively (Without Overwhelm)
Instead of switching between classes, an excellent student practices regularly:
-
Practice Consistently Every Day: Set aside specific time each day for practice exercises, which will reinforce what you've learned and boost your confidence via concentration and repetition.
-
Work On Real Datasets: Apply principles, get hands-on experience, and comprehend how data analytics tools address real-world business issues by using real-world facts.
-
Build Case Studies Methodically: Create concrete proof of analytical thinking for employers by documenting issues, strategies, instruments, and results in case studies.
-
Document Your Learning Process: To efficiently track progress and show organized problem-solving in your portfolio, take notes on obstacles, revelations, and solutions.
-
Create Small Projects Sequentially: To ensure that skills develop continuously while preventing overwhelm or dissatisfaction while learning, start with manageable projects and progressively add complexity.
-
Review And Reflect Regularly: Regularly evaluate your work, point out errors, and improve your methodology to increase comprehension and the caliber of the insights generated.
How to Get Your First Data Analytics Job
Here’s how to stand out even without a tech resume:
-
Highlight Analytical Experience: Rework your professional background to highlight problem-solving, data interpretation, and decision-making, showcasing how your abilities meet analytics needs.
-
Showcase Transferable Skills: Stress skills like communication, research, and commercial acumen that are useful in data analytics careers, even for non-technical backgrounds.
-
Build Online Presence: Make LinkedIn and portfolio profiles with projects, case studies, and accomplishments to show off your skills and successfully draw in recruiters.
-
Gain Practical Experience: Concentrate on practical projects and internships that provide you exposure to the real world and demonstrate to prospective employers your capacity to handle real-world business issues.
-
Prepare For Interviews: Use case studies, scenario-based inquiries, and narrative strategies to demonstrate your data-driven decision-making methodology and explain insights with confidence.
-
Network Strategically Online: To generate opportunities for recommendations and mentorship, interact with professionals, participate in analytics groups, go to webinars, and establish connections with hiring managers.
At this point, practical experience gained through real projects, internships, and case studies is significantly more beneficial than classroom instruction or theoretical understanding.
Common Mistakes You Should Avoid
Most people don’t fail because they lack intelligence — they fail because they:
-
Trying To Learn Everything: Real progress is slowed and overwhelming when all tools and concepts are attempted to be mastered at once.
-
Neglecting Real Projects: The development of practical abilities and data analysis experience is prevented by concentrating solely on theory without creating practical projects.
-
Comparing With Engineers: Everybody's learning process is unique, therefore comparing yourself to technical experts leads to needless stress and despair.
-
Waiting To Be Perfect: A delayed job transition and missed chances result from waiting until you feel "100% ready."
-
Ignoring Networking Opportunities: Lack of interaction with professionals in the field restricts access to career prospects, mentoring, and advice.
-
Skipping Portfolio Documentation: You lose credibility and the opportunity to demonstrate your analytical skills if you don't document and display your work.
Setting Expectations: Realistic Timeline
It takes time to launch a career in data analytics. Here is a useful, step-by-step schedule to help you with your education and career readiness:
a. 0–3 Months: Foundations
Prioritize mastering the fundamentals. Gain familiarity with Google Sheets or Excel, comprehend important statistics, and understand how data functions. Consider this as laying a strong basis for yourself.
b. 3–6 Months: Projects & Visualization Tools
Put everything you've learnt into practice. Use SQL or visualization programs like Tableau or Power BI to work on small tasks. You can practice actual data analysis here.
c. 6–9 Months: Portfolio + Job Applications
You ought to have projects to present by now. Create a portfolio, record your work, and begin submitting applications for entry-level data analytics positions or internships. Your objective is to boldly showcase your skills to potential employers.
Transitioning into data analytics from a non-technical background can feel daunting, but you likely possess many of the necessary skills already. Start with small, manageable tasks that offer practical value, and leverage your existing experience. Each report you enhance and every insight you gain will build your credibility and confidence. Keep learning at a steady pace, track your progress, and share your work along the way. If you remain persistent and curious, you'll find opportunities opening up in unexpected ways. Although the journey may be gradual, every effort moves you closer to personal growth and exciting new possibilities.