


Top 10 Data Analytics Tools
Explore the top 10 data analytics tools to organize, visualize, and understand your data easily. Learn features, types, and choose the right tool for your needs.
Small businesses gather significant information every day, such as what goods sell, when customers visit, and what comments they leave. Imagine enhancing your store with this knowledge. Knowing these specifics enables you to design promotions, stock popular items, and provide a better experience that attracts and retains customers.
The process of gathering this data, thoroughly examining it, and drawing conclusions from the results is known as data analytics. Enrolling in an analytics course can help beginners understand the content step by step. This type of education teaches you how to analyze data, identify trends, and make business-wise decisions.
Making good use of data can change your store. You may enhance customer experiences, choose which products to carry, and schedule sales for slower days. You may see tangible results without feeling overburdened and make better judgments every day by mastering basic analytics techniques.
What is Data Analytics?
The practice of analyzing data to identify valuable trends and insights is known as data analytics. It assists people and organizations in understanding the situation, making better decisions, and resolving issues with facts rather than conjecture or guesswork.


Data analytics may show what is effective and what requires improvement by examining statistics, patterns, and outcomes. Sales planning, performance monitoring, and customer experience enhancement are all aided by it. Effective data utilization increases the confidence and intelligence of daily judgments.
The Importance of Data Analytics in the Modern Era
-
Better Decision Making: Businesses and people can make fact-based decisions with the aid of data analytics. Decisions become more dependable and efficient in day-to-day operations as a result of fewer errors and better results.
-
Understanding Customers: By examining consumer behavior and preferences, companies may provide goods and services that consumers genuinely desire, increasing customer happiness and fostering enduring partnerships.
-
Identifying Trends: Over time, data analytics reveals trends. Early trend recognition enables companies to stay ahead of the competition, plan ahead, and react swiftly to developments.
-
Improving Efficiency: Process analysis reveals areas where money, time, or effort is being wasted. Companies may do jobs more efficiently, save money, and streamline processes.
-
Boosting Sales and Revenue: Data insights assist in determining which products sell best, when promotions should be held, and which tactics boost revenue without taking needless risks.
-
Supporting Growth and Innovation: Businesses get an advantage in a market that is continuously evolving by using data to evaluate tactics, extend services, and investigate new ideas.
Understanding the Types of Data Analytics Tools
1. Descriptive Analytics Tools
Descriptive analytics tools summarize data into easily readable charts, tables, and reports, which aid in understanding previous events. They make it easy to see trends, monitor performance, and make simple decisions with assurance.
Which Tools Can Be Used: Excel, Google Sheets, Zoho Analytics
2. Visualization Tools
Visualization tools assist in transforming data and figures into dashboards, graphs, and charts that are simple to comprehend. Because they clearly show patterns and trends, you can communicate your findings with others more quickly and base judgments on what the visuals show.
Which Tools Can Be Used: Tableau, Power BI
3. Predictive Analytics Tools
Predictive analytics tools use historical data to estimate future patterns. They help you make better decisions, lower risks, and prepare ahead by displaying potential outcomes. Demand planning, corporate strategy, and sales forecasting may all benefit from these technologies.
Which Tools Can Be Used: Python (with Pandas, Scikit-learn), R
4. Data Management Tools
Data management technologies can collect, organize, and clean information from various sources. They ensure that the data is accurate, structured, and ready for analysis. By utilizing these technologies, the analytical process becomes more efficient and dependable, while also saving time and reducing errors.
Which Tools Can Be Used: Alteryx, Talend, Apache Nifi
Key Factors to Consider When Choosing a Data Analytics Tool
-
Ease of Use: Select a tool that is easy to use and simple. Learning and doing data analysis is easy and fun for beginners, who may get started right away without feeling overwhelmed.
-
Cost: Think about if the tool is within your price range. While some tools may be used for free, some cost money. Make sure the elements you want for precise and effective data analysis are priced appropriately.
-
Integration: Connecting the tool to your current systems, such as databases or spreadsheets, should be simple. Errors are decreased, time is saved, and you can swiftly compile data from many sources with seamless integration.
-
Features and Capabilities: Look for tools like dashboards, infographics, or predictive insights that provide the features you want. Verify that the features fit your present objectives and room for expansion.
-
Support and Learning Resources: Beginners learn more quickly when there is clear documentation, tutorials, or community support available. Strongly guided tools enable you to overcome issues and advance your abilities without becoming trapped.
-
Scalability: Select a tool that can adapt to your changing demands. The tool should be able to handle greater data sets and more complicated analysis without slowing you down as your projects grow in size or complexity.
Discover the Top 10 Data Analytics Tools
1. Excel


Excel is a widely used program for data organization, analysis, and visualization. Making charts, tables, and computations is simple even for beginners. For easy and efficient data processing, it is frequently utilized in companies, educational institutions, and individual initiatives.
Key Features:
-
Data Organization: Excel enables users to quickly handle massive amounts of text and numbers for rapid comprehension, store information in rows and columns, and organize data with ease.
-
Formulas and Calculations: Formulas can be used to carry either basic or sophisticated computations. This facilitates the speedy tracking of totals, averages, percentages, and other important data.
-
Charts and Graphs: Excel allows users to create visual charts from data. These graphs assist successfully convey information to others by highlighting trends.
2. Google Sheets
Google Sheets is an online application for data analysis and organization. Similar to Excel, it is cloud-based, making collaboration simple. Beginners are able to do computations, create tables, and instantly share their work with others.
Key Features:
-
Cloud Collaboration: The same spreadsheet can be worked on by several people at once. Automatic saving of changes makes collaborating easy and effective without erasing any data or progress.
-
Formulas and Functions: Simple mathematical formulae like sums, averages, and percentages are available in Google Sheets, assisting users in precisely analyzing data and swiftly reaching well-informed conclusions.
-
Charts and Visuals: To transform raw data into clear visuals for presentations or instant insights, users may construct charts, graphs, and dashboards.
3. Zoho Analytics
Zoho Analytics is a user-friendly platform that simplifies the process of collecting, organizing, and visualizing data. Even beginners without technical skills can create dashboards and reports. It is particularly beneficial for teams and small businesses, helping them analyze trends and make informed decisions.
Key Features:
-
Data Visualization: Teams immediately understand insights using Zoho Analytics' interactive charts, graphs, and dashboards that highlight patterns and trends.
-
Data Integration: Spreadsheets, databases, and cloud apps are just a few of the data sources it can connect to, which makes it simpler to collect and examine data from many sources.
-
Collaboration Tools: Users can collaborate on data projects effectively, share dashboards and reports with coworkers, and assign permissions, all of which enhance decision-making and cooperation.
4. Tableau
Tableau is a tool for creating interactive dashboards and visuals from data. With its user-friendly interface, beginners can quickly identify trends and patterns. It allows teams and organizations to easily comprehend data and make more informed decisions.
Key Features:
-
Interactive Dashboards: By enabling users to build dynamic dashboards that are updated in real time, Tableau facilitates data exploration and insight discovery without being bogged down in statistics.
-
Data Connectivity: Users may integrate data from several sources for comprehensive analysis by connecting to a variety of data sources, including databases, spreadsheets, and cloud services.
-
Visual Analytics: To display data graphically, users may create maps, graphs, and charts. Sharing findings with others, comparing outcomes, and explaining trends are all made easier as a consequence.
5. Power BI
Raw data may be transformed into understandable dashboards and graphics with the help of Power BI. Tracking trends, comparing outcomes, and exchanging thoughts is simple for novices. Businesses utilize it extensively to make decisions more quickly and intelligently.
Key Features:
-
Interactive Reports: With the help of Power BI, users can easily analyze data and quickly and clearly identify trends by creating interactive reports and dashboards that refresh automatically.
-
Data Integration: Users may collect all pertinent data in one location for thorough analysis because of its connections to other sources, including databases, cloud apps, and Excel.
-
Sharing and Collaboration: Decision-making is facilitated by the ability for users to collaborate on insights, share dashboards with colleagues, and assign permissions.
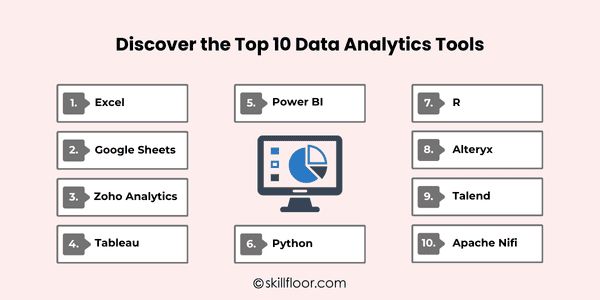
6. Python
Python is a computer language that facilitates data organization, analysis, and visualization. Without requiring sophisticated technical knowledge, novices may use it to examine data, see patterns, and make judgments using basic commands and libraries.
Key Features:
-
Data Handling with Libraries: Python makes it simple for beginners to work with big datasets by using libraries like Pandas and NumPy to quickly organize, clean, and analyze data.
-
Visualization Tools: With the help of libraries like Matplotlib and Seaborn, numbers may be transformed into easily understood and shared charts, graphs, and plots.
-
Automation and Flexibility: Python gives users the freedom to examine data in a variety of ways and save time by automating repetitive operations and carrying out complex computations.
7. R
R is a statistical and data analysis tool. It may be used by beginners to analyze patterns, generate charts, and examine data. It is well-liked for reporting, research, and learning both simple and complex data approaches.
Key Features:
-
Statistical Analysis: Understanding patterns and correlations in data is made easier by R's extensive statistical test and computation capabilities.
-
Data Visualization: R provides packages like ggplot2 to assist novices display data in an easy-to-understand manner by enabling them to produce clear charts, graphs, and plots.
-
Extensive Packages: With its numerous free packages for anything from data cleansing to trend modeling, R offers users freedom for a wide range of investigation.
8. Alteryx
Alteryx is a tool that enables speedy data preparation, cleaning, and analysis. Its drag-and-drop interface makes it simple for novices to interact with data effectively, which facilitates trend analysis and decision-making.
Key Features:
-
Data Preparation: Users may save time and ensure that data is accurate for analysis by using Alteryx to clean, integrate, and organize data from various sources.
-
Workflow Automation: By automating repetitive operations, users may save manual labor and increase productivity in their everyday data work by creating repeating workflows.
-
Analytics and Reporting: Alteryx offers tools for analysis and dashboard or report creation, assisting novices in successfully communicating findings and visualizing outcomes.
9. Talend
Alteryx is a tool that enables speedy data preparation, cleaning, and analysis. Its drag-and-drop interface makes it simple for novices to interact with data effectively, which facilitates trend analysis and decision-making.
Key Features:
-
Data Integration: Talend makes it simple for users to integrate data for thorough analysis by connecting data from many sources, including databases, spreadsheets, and cloud apps.
-
Data Cleaning: It assists with eliminating mistakes, repetitions, and discrepancies, guaranteeing that the data utilized for analysis is precise and trustworthy for improved decision-making.
-
Automation: Automatic workflows may be set up by users to process data on a regular basis, saving time and minimizing human labor while maintaining current information.
10. Apache Nifi
A technology called Apache NiFi facilitates the management, organization, and transfer of data from many sources. It makes it simpler to swiftly gather information and get it ready for analysis by automating data flows, which even beginners can utilize.
Key Features:
-
Data Flow Automation: By enabling users to automate data transfer between systems, NiFi minimizes human labor and guarantees reliable and efficient information transfer.
-
Real-Time Data Processing: Users may analyze, route, and track information instantaneously for quicker decision-making because of its real-time data handling capabilities.
-
Visual Interface: NiFi makes it simpler for novices to set up and monitor processes without knowing how to code by providing a drag-and-drop interface for designing data flows.
Tips for Choosing the Right Data Analytics Tools
-
Trial Versions: Before buying, try demo or free versions. This enables you to securely test the tool's functionality, workflow, and interface to determine if it meets your needs.
-
Community and Support: Look for active help channels, forums, or communities. Helpful communities make learning and troubleshooting much simpler for novices by responding to queries, exchanging advice, and offering direction.
-
Mobile Access: Think about how effectively the tool functions on mobile devices. Making choices more quickly while on the go, being informed, and increasing efficiency are all made possible by having access to dashboards or reports at any time.
-
Customizability: Look for resources that enable you to alter reports, dashboards, or processes. Flexibility guarantees that the tool will adjust to your demands instead of requiring you to modify your own workflow.
-
Security Features: Make sure the tool has strong security features like permissions, encryption, and access control. For safe and ethical use, sensitive client or company data must be protected.
-
Learning Curve: Assess the tool's ease of use and learning. Beginners may get started quickly and confidently without feeling overwhelmed with the use of tutorials, templates, or guided installations.
Using the right data analytics tools can make a big difference for any small business or beginner trying to understand information. Discovering tools such as Excel, Tableau, or Python may help you see trends, transform raw data into meaningful insights, and make better decisions every day. Effective and pleasurable learning is achieved by selecting a tool that meets your goals, is simple to use, and assists. Begin modestly, try out different features, and progressively increase your confidence in managing data. These technologies will eventually help you in improving client experiences, saving time, and developing more effective tactics. Remaining interested, practicing, and enjoying the process of learning from your data are crucial.