


What is the Data Analytics Life Cycle? A Step-by-Step Guide
Discover the Data Analytics Life Cycle and learn its simple step-by-step process to turn raw data into insights that drive business growth and smart decisions.
Every day, businesses generate vast amounts of data, from customer purchases to website activity. However, having data alone is not enough. Converting such data into practical insights that aid in decision-making is where the true reward lies. Here's where data analytics can help.
Good data analysis follows a defined procedure known as the Data Analytics Life Cycle; it is not random. This methodical methodology assists analysts in comprehending the business problem, carefully analyzing the facts, and ultimately producing insights that can direct choices and enhance outcomes over time.
What Is the Data Analytics Life Cycle?
The Data Analytics Life Cycle is a methodical, systematic procedure that helps businesses in efficiently handling data. It transforms unprocessed data into insightful knowledge that helps make better choices. This method focuses on solving the appropriate business challenges in an orderly and methodical manner, in addition to utilizing tools and developing code.
Key Characteristics of the Data Analytics Life Cycle


-
Follows a structured step-by-step approach
-
Helps solve real business problems
-
Turns data into meaningful insights
-
Supports informed decision-making
-
Encourages continuous improvement and iteration
By following these guidelines, businesses can precisely define their objectives of data analytics, guaranteeing that every analysis produces significant outcomes and effectively enhances business decisions.
Why the Data Analytics Life Cycle Matters More Than Ever
We are about to enter a time when every choice is based on data, competition is moving more quickly, customer expectations are higher, and errors are far more expensive:
1. Markets Change Faster
Businesses must quickly adapt to changing customer wants, trends, and technological advancements to avoid falling behind competitors.
2. Customers Expect Personalization
Customers like offerings, messaging, and services that are tailored to them rather than generic, or else they will choose to use someone else.
3. Competition Is Global
Smart judgments are more important than ever because businesses are no longer only competing locally; anyone may reach the same clients from anywhere.
4. Margins Are Thinner
Since most businesses have smaller profit margins, even little errors in operations, pricing, or strategy can have significant repercussions.
5. Mistakes Are More Expensive
Making poor decisions costs money, effort, and client trust, therefore making data-driven decisions is crucial to maintaining profitability and long-term growth.
6. Speed Matters More Than Ever
While slow-moving companies frequently miss out on opportunities they can't get back, the fastest teams that evaluate data and act swiftly win.
Businesses who use data analysis may swiftly identify trends, make wiser decisions, and remain ahead while others find it difficult to keep up in this fast-paced environment.
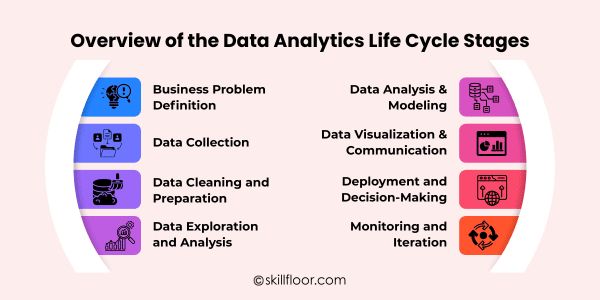
Overview of the Data Analytics Life Cycle Stages
A typical data analytics lifecycle consists of the following stages:
-
Business Problem Definition
-
Data Collection
-
Data Cleaning and Preparation
-
Data Exploration and Analysis
-
Data Analysis & Modeling

-
Data Visualization & Communication
-
Deployment and Decision-Making
-
Monitoring and Iteration


Let’s walk through each stage step by step.
Step 1: Business Problem Definition
Every effective data project begins with a well-defined business goal. Before you start working with any data, you need to comprehend:
-
What decision are we trying to make?
-
What problem are we trying to solve?
-
What does success look like?
Examples:
-
“Why is customer churn increasing?”
-
“Which marketing channel actually drives profit?”
-
“How can we reduce delivery delays?”
If this step is skipped, dashboards may appear spectacular yet offer unclear or useless insights.
Step 2: Data Collection
The next stage is to gather all the relevant data for analysis from several sources after the problem has been properly defined.
Data can come from many sources, such as:
-
Company databases
-
CRM systems
-
Website logs
-
APIs
-
Surveys
Data may be:
-
Structured (tables, spreadsheets)
-
Semi-structured (JSON, logs)
-
Unstructured (text, images)
Accurate, pertinent, and problem-appropriate data collection is critical to the success of your study, especially for effective data analytics applications.
Step 3: Data Cleaning and Preparation
Since processing involves correcting errors, addressing missing values, and structuring the data, this step frequently takes the longest.
Real-world data is messy. It may contain:
-
Missing values
-
Duplicate records
-
Incorrect formats
-
Inconsistent entries
-
Outliers and errors
In this stage, you:
-
Clean the data
-
Standardize formats
-
Handle missing values
-
Remove duplicates
-
Create new useful features
Inaccurate, incomplete, or messy data cannot be corrected or made sense of by any model, dashboard, or AI system.
Step 4: Data Exploration and Analysis
The next stage is to examine and comprehend the data after it has been cleaned up, searching for trends and patterns.
This is where you:
-
Explore patterns
-
Spot trends
-
Find anomalies
-
Test assumptions
-
Ask better questions
Using:
-
Statistics
-
Visualizations
-
Correlations
-
Segmentations
Unexpected patterns found during exploratory data analysis (EDA) frequently yield the most insightful responses you didn't know to ask at first.
Step 5: Data Analysis and Modeling
In this phase, you use machine learning models or statistical methods to address your business inquiries.
Depending on the problem, this could involve:
-
Descriptive analysis (what happened?)
-
Diagnostic analysis (why did it happen?)
-
Predictive analysis (what will happen?)
-
Prescriptive analysis (what should we do?)
The purpose of this stage is to choose the appropriate model for the business challenge rather than the most complicated model.
Step 6: Data Visualization & Communication
Only when insights are clearly communicated and enable people to comprehend the data and take relevant action can they become valuable.
In this stage, you:
-
Create dashboards, charts, and reports
-
Simplify complex findings
-
Tell a clear and compelling data story
-
Highlight key trends and insights for decision-makers
-
Make data easy to interpret for non-technical audiences
Great analytics communication:
-
Is simple
-
Is visual
-
Is decision-focused
-
Speaks business, not technical jargon
The purpose of communication and visualization is to clearly influence decisions and motivate action, not to dazzle people with intricacy.
Step 7: Deployment and Decision-Making
Here's where analytics really matters: applying data insights to make smarter, well-informed business decisions.
This is where insights become:
-
New strategies
-
Process changes
-
Automated systems
-
Smarter decisions
Examples:
-
Changing pricing strategy
-
Reallocating marketing budgets
-
Improving customer onboarding
-
Optimizing supply chains
At this point, business analytics insights go beyond basic analysis and begin to motivate actual actions that enhance business performance and outcomes.
Step 8: Monitoring and Iteration
After deployment, the data analytics life cycle continues, necessitating constant observation, input, and modifications to maintain accurate and pertinent insights.
You must:
-
Monitor results
-
Track KPIs
-
Check if models or assumptions are still valid
-
Improve and refine the solution over time
Business environments change, customer behavior changes, and data changes — so analytics must continuously evolve.
Tools Commonly Used in the Data Analytics Life Cycle
Many businesses use a variety of data analytics tools to effectively manage various phases, from gathering data to producing insights and reports:
1. Data Collection
For efficient analysis, tools like SQL, APIs, Excel, and web scraping assist in gathering precise, pertinent data from various sources.
2. Data Cleaning & EDA
Data is cleaned, arranged, and examined using Python, Pandas, R, and Excel in order to identify significant patterns and trends.
3. Analysis & Modeling
Data-driven decision-making is supported by statistical analysis, predictive modeling, and insight extraction made possible by Python, R, Scikit-learn, and SQL.
4. Visualization
Charts, graphs, and dashboards can be made with the aid of Power BI, Tableau, Matplotlib, and Seaborn to effectively convey findings to stakeholders.
5. Reporting
PowerPoint, dashboards, and notebooks are examples of tools that provide results in an easy-to-understand and actionable manner.
6. Monitoring & Iteration
Data tools monitor outcomes over time, assess performance, and assist in updating dashboards or models to enhance accuracy and business choices.
A Simple Real-World Example
Imagine a subscription service losing clients each month. To comprehend and resolve the issue, they choose to adhere to the Data Analytics Life Cycle.
-
Problem: What can we do to retain our consumers and why are they leaving?
-
Data: To identify trends, gather billing data, support tickets, and usage logs.
-
Cleaning: Make that the data is correct, fix any missing information, and eliminate duplicates.
-
Analysis: Examine the statistics and discover that after the third week, churn is at its peak.
-
Modeling: Determine which clients are most likely to depart based on historical trends.
-
Visualization: Give the leadership a comprehensive knowledge of the main causes of churn.
-
Action: Enhance onboarding procedures and give at-risk clients proactive assistance.
-
Monitor: Track outcomes and observe an 18% decrease in churn over a three-month period.
This methodical approach transforms unprocessed data into useful insights, demonstrating how the life cycle has genuine business value.
Common Mistakes in the Data Analytics Life Cycle
1. Starting With Data
Without first defining the business problem, diving right into data results in lost time and insights that don't address any significant issues.
2. Ignoring Data Quality
Unreliable conclusions, wasted labor, and judgments that could be detrimental to the company are the effects of using untidy, incomplete, or erroneous data.
3. Focusing Only on Models
Excessive time spent on intricate models without taking into account the real business impact frequently yields solutions that are ineffective.
4. Poor Result Communication
Even the greatest discoveries fall short if they are not presented in a way that decision-makers can immediately comprehend, clearly, and visually.
5. Skipping Follow-Up Steps
When results are not monitored or analysis is not updated, insights become out of date and issues may resurface without anybody noticing.
6. Relying Just on Tools
Without adhering to a structured analytics process, relying solely on software may result in resource waste and uneven outcomes.
Managing data is only one aspect of mastering the Data Analytics Life Cycle; another is developing a clear path from inquiries to decisions. You can transform raw data into insightful information that can genuinely alter how your company operates by meticulously following every step, from defining the business challenge to tracking outcomes. The real power is in making the connection between analysis and action, so that every choice is supported by knowledge rather than speculation. Teams may stay ahead of the competition, move more quickly, and respond to clients more intelligently by adopting the Data Analytics Life Cycle. Every dataset turns into an opportunity, every trend becomes a possibility for improvement, and every choice into a stride toward more robust, self-assured progress.