































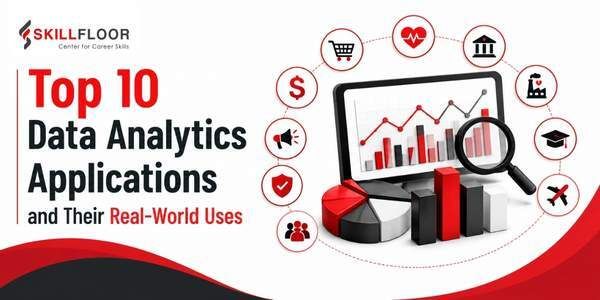
Top 10 Data Analytics Applications and Their Real-World Uses
Explore the top 10 data analytics applications and their real-world uses across industries, from business intelligence and healthcare to finance, marketing, and more.
Data has become an important part of how modern businesses work. Every day, companies collect huge amounts of information from customers, online platforms, and business operations. But this data is not useful until it is properly analyzed and turned into meaningful insights.
Data analytics helps in doing exactly that. It takes raw data and converts it into clear information that businesses can use to understand patterns, improve performance, and make better decisions.
Today, data analytics is used across many industries such as healthcare, banking, retail, and marketing to solve real business problems and improve outcomes.
In this blog, we will look at the Top 10 Data Analytics Applications and Their Real-World Uses to understand how data is applied in practical situations across different industries.


What Is Data Analytics Used For?
Data analytics is the process of examining raw and structured data to uncover patterns, trends, and actionable insights that support better decision-making. In today’s digital economy, organizations across industries generate massive volumes of data every second—from customer interactions and financial transactions to healthcare records and supply chain movements.
This data on its own has limited value until it is processed and analyzed. Through data analytics techniques, businesses can transform data into meaningful insights that drive strategic decisions, operational efficiency, and business growth. For example, companies use analytics to understand customer behavior, optimize pricing strategies, detect fraud, improve healthcare outcomes, and forecast future demand.
As organizations increasingly rely on data-driven decision-making, data analytics has become a core function in modern business operations rather than just a support tool. It plays a key role in improving accuracy, reducing uncertainty, and enabling faster responses to market changes. These capabilities are reflected across various practical applications of data analytics, from customer behavior analysis and fraud detection to healthcare optimization and demand forecasting.
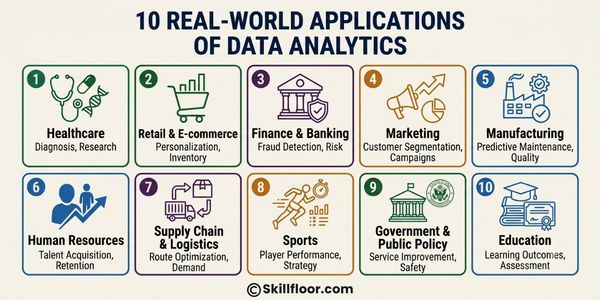
10 Real-World Applications of Data Analytics
1. Healthcare – Patient Outcomes & Resource Optimization
Healthcare organizations increasingly rely on data analytics to move beyond reactive treatment and adopt a predictive and preventive approach. By analyzing large volumes of patient data such as medical history, diagnosis patterns, seasonal illness trends, and treatment responses, hospitals can make more accurate decisions about care delivery.
Analytics also helps healthcare systems manage operational pressure by improving how resources are allocated. Instead of overloading staff or running short on critical infrastructure, hospitals can anticipate demand in advance and plan accordingly.
The growing importance of healthcare analytics is reflected in market forecasts, with the global healthcare analytics market expected to reach USD 198.8 billion by 2033, driven by the increasing adoption of data-driven healthcare solutions
Key Features:
-
Patient admission trend analysis for forecasting hospital load
-
Identification of disease pattern cycles (seasonal outbreaks, recurring conditions)
-
Evaluation of treatment effectiveness across patient groups
-
Optimization of ICU beds, staff allocation, and emergency readiness
Best Use Cases:
-
Predicting emergency room demand
-
Improving patient recovery rates
-
Hospital capacity and staffing planning
Common Tools: SQL, Excel, Power BI, Python
2. Retail & E-commerce – Customer Intelligence & Demand Forecasting
Retail and e-commerce platforms use data analytics to deeply understand customer behavior patterns and improve business decision-making. Every click, search, purchase, and cart abandonment generates valuable data that helps retailers refine their strategies.
Instead of relying on assumptions, companies now use behavioral data to predict what customers are likely to buy, when they will buy, and how they respond to pricing or promotions. This leads to more personalized shopping experiences and better inventory control.
The increasing use of customer analytics across industries has also highlighted the importance of developing practical analytics skills, which many learners build through project-based training programs offered by organizations such as Skillfloor.
Key Features:
-
Customer journey analysis across platforms
-
Identification of high-demand and low-performing products
-
Personalized recommendation engine optimization
-
Seasonal and regional demand forecasting



Best Use Cases:
-
Improving product recommendations
-
Reducing stockouts and overstocking
-
Enhancing customer engagement and conversion rates
Common Tools: Excel, SQL, Tableau, Power BI
3. Finance & Banking – Fraud Detection & Risk Management
The financial sector uses advanced data analytics systems to monitor transactions in real time and detect irregular financial activity. With increasing digital transactions, banks depend on analytics to identify fraud patterns that are difficult to detect manually.
Beyond fraud detection, analytics also play a key role in credit risk assessment, helping financial institutions evaluate whether a customer is eligible for loans or credit based on historical financial behavior.
Key Features:
-
Real-time transaction anomaly detection
-
Fraud pattern recognition systems
-
Credit scoring and loan eligibility analysis
-
Regulatory compliance monitoring
Best Use Cases:
-
Preventing financial fraud
-
Improving loan approval accuracy
-
Strengthening banking security systems
Common Tools: SQL, Python, Excel, Power BI
4. Marketing – Campaign Optimization & Audience Targeting
Modern marketing is heavily driven by data analytics, where every campaign is measured, tracked, and optimized based on performance metrics. Instead of running broad campaigns, businesses now focus on data-backed targeting strategies that improve engagement and conversion rates.
Analytics helps marketers understand how different audiences respond to messaging across platforms like email, search engines, and social media.
Key Features:
-
Campaign performance analysis across channels
-
Customer segmentation based on behavior and interests
-
Conversion funnel tracking and optimization
-
ROI and budget allocation analysis
Best Use Cases:
-
Improving digital advertising performance
-
Enhancing audience targeting strategies
-
Increasing marketing ROI
Common Tools: Excel, Google Analytics, SQL, Power BI
5. Manufacturing – Quality Control & Predictive Maintenance
This approach, known as predictive maintenance, reduces unexpected machine failures and minimizes production downtime, thereby improving operational efficiency and reducing costs.
The rise of Industry 4.0 has further accelerated the adoption of manufacturing analytics, enabling organizations to use real-time production data, automation, and advanced analytics to improve efficiency, quality control, and operational decision-making.
Key Features:
-
Real-time machine performance monitoring
-
Detection of production defects and anomalies
-
Predictive maintenance scheduling
-
Production efficiency optimization
Best Use Cases:
-
Reducing factory downtime
-
Improving product quality consistency
-
Optimizing production processes
Common Tools: Excel, SQL, Python, Power BI
6. Human Resources – Workforce Analytics & Retention Strategy
HR departments use workforce analytics to understand employee behavior and improve organizational efficiency. By analyzing attrition trends, employee performance data, and hiring patterns, companies can make better decisions about talent management.
It also helps organizations identify factors that contribute to employee dissatisfaction and turnover, allowing them to build better workplace strategies.
Key Features:
-
Employee attrition prediction models
-
Performance and productivity tracking
-
Hiring pattern analysis
-
Workforce demand forecasting
Best Use Cases:
-
Reducing employee turnover
-
Improving hiring efficiency
-
Enhancing workforce planning
Common Tools: Excel, Power BI, SQL
7. Supply Chain & Logistics – Route Optimization & Demand Planning
Supply chain systems rely heavily on logistics analytics to ensure products move efficiently from suppliers to customers. Companies analyze traffic patterns, order volumes, and warehouse data to design optimized delivery routes and reduce operational delays.
Analytics also helps forecast demand so inventory is always available at the right location, preventing both shortages and excess stock.
Key Features:
-
Route optimization algorithms
-
Demand forecasting and planning
-
Inventory tracking and management
-
Delivery performance monitoring
Best Use Cases:
-
Faster delivery operations
-
Reduced logistics costs
-
Improved supply chain efficiency
Common Tools: Excel, SQL, Python, Power BI
8. Sports – Performance Analytics & Strategy Development
Sports teams use performance analytics to improve decision-making on and off the field. By analyzing player statistics, movement patterns, and match data, teams can develop better strategies and improve overall performance.
Analytics also plays an important role in reducing injury risk by tracking player workload and physical stress levels over time.
Key Features:
-
Player performance evaluation systems
-
Opponent strategy analysis
-
Fitness and injury risk monitoring
-
Match performance insights
Best Use Cases:
-
Strategy building for matches
-
Player training optimization
-
Injury prevention programs
Common Tools: Excel, Python, Tableau
9. Government & Public Policy – Data-Driven Governance
Governments use data analytics systems to improve decision-making in public administration. By analyzing population trends, infrastructure data, and socio-economic indicators, authorities can design more effective policies.
It also helps evaluate the success of government programs and ensures resources are allocated where they are most needed.
Key Features:
-
Population and demographic analysis
-
Public service performance tracking
-
Infrastructure planning insights
-
Policy impact evaluation
Best Use Cases:
-
Urban development planning
-
Welfare program optimization
-
Public resource allocation
Common Tools: Excel, SQL, Power BI
10. Education – Learning Analytics & Curriculum Improvement
Educational institutions use learning analytics to improve teaching quality and student outcomes. By analyzing attendance, grades, and learning patterns, institutions can identify struggling students early and provide targeted support.
It also helps improve curriculum design by identifying which teaching methods are most effective for student success.
Key Features:
-
Student performance tracking systems
-
Learning behavior analysis
-
Attendance and engagement monitoring
-
Curriculum effectiveness evaluation
Best Use Cases:
-
Personalized learning support
-
Academic performance improvement
-
Curriculum optimization
Common Tools: Excel, Power BI, SQL
Core Data Analytics Skills and Their Business Value
Behind every real-world application of data analytics are foundational skills that enable professionals to collect, analyze, visualize, and interpret data effectively.
|
Analytics Skill |
What It Helps Organizations Do |
Common Tools |
Career Role |
|
Data Cleaning |
Improve data quality and accuracy before analysis |
Excel, SQL, Python |
Data Analyst |
|
Data Visualization |
Present insights through dashboards and reports |
Power BI, Tableau |
BI Analyst |
|
SQL Querying |
Extract and manage data from databases |
SQL, MySQL |
Data Analyst |
|
Statistical Analysis |
Identify trends, patterns, and relationships in data |
Excel, Python |
Business Analyst |
|
Data Storytelling |
Communicate findings to stakeholders effectively |
Power BI, Tableau |
Business Analyst |
|
Predictive Analytics |
Forecast future outcomes and business trends |
Python, Machine Learning |
Data Scientist |
|
Dashboard Development |
Monitor KPIs and business performance in real time |
Power BI, Tableau |
BI Analyst |
|
Customer Analytics |
Understand customer behavior and preferences |
SQL, Google Analytics |
Marketing Analyst |
|
Business Reporting |
Support decision-making through structured reports |
Excel, Power BI |
Reporting Analyst |
|
Data-Driven Decision Making |
Transform insights into business actions |
SQL, Power BI, Python |
Analytics Consultant |
While industries apply data analytics differently, success in analytics careers depends on mastering the core skills that support data-driven decision-making.
How These Applications Translate Into Analytics Careers
The examples above are not isolated use cases – they represent the kind of work that Data Analysts, Business Analysts, and Business Intelligence Analysts do every day. Whether it's analyzing sales trends in retail or tracking patient data in healthcare, the underlying skill set stays similar: working with data in Excel or SQL, building dashboards in Power BI or Tableau, and using Python for deeper analysis when needed.
If you're exploring a career switch or starting fresh, the good news is that these skills are learnable step by step, and many of them overlap across industries. Someone trained in core analytics tools can move between sectors like retail, finance, or healthcare with relatively small adjustments.
The growing adoption of analytics across industries also highlights the expanding career opportunities in data analytics, as organizations continue to invest in professionals who can turn data into actionable business insights.
How to Start Building These Skills
If the applications above sound like the kind of work you'd want to do, the most practical starting point is learning the core toolset: Excel for data handling, SQL for querying databases, and a visualization tool like Power BI or Tableau for building dashboards. Python becomes useful once you want to move into more advanced analysis or automation.
A structured Data Analytics training program can help bring these tools together with real project work, so you're not just learning concepts in isolation but applying them the way analysts do on the job. If you're considering this path, Skillfloor's Data Analytics training program is built around this kind of practical, hands-on learning.
FAQ's
1. What is data analytics used for in real life?
It's used to study data and find patterns that help with decisions – like predicting hospital admissions, understanding customer buying habits, detecting fraud, or planning delivery routes. The applications listed above cover some of the most common real-world examples.
2. Which industries use data analytics the most?
Healthcare, retail, finance, marketing, manufacturing, logistics, and education industries, where analytics is widely used, though the specific use cases and maturity of adoption vary by organization.
3. What skills do I need to apply for analytics roles?
Most entry-level analytics roles look for comfort with Excel and SQL, a basic understanding of data visualization tools like Power BI or Tableau, and the ability to interpret data to answer business questions. Python is helpful but not always required at the entry level.
4. Can a beginner learn data analytics without a coding background?
Yes. Many analytics roles start with Excel and SQL, which don't require prior coding experience. Python and more advanced tools can be picked up gradually as you progress.
5. What tools should I learn first – Excel, SQL, Python, or Power BI?
A common learning order is Excel first (since it's widely used and intuitive), followed by SQL (for working with databases), then a visualization tool like Power BI or Tableau, and Python later for more advanced analysis
6. Is data analytics a good career choice?
Data analytics roles are in demand across multiple industries because most organizations rely on data to make decisions. Whether it's the right choice for you depends on your interest in working with data, problem-solving, and continuous learning, since tools and techniques in this field keep evolving.
Data analytics is no longer limited to reports or dashboards—it has become a core part of how modern industries operate and make decisions. The applications covered in this blog clearly show how data is actively used to solve real business challenges, whether it is improving healthcare systems, strengthening financial security, enhancing customer experience, or optimizing operations across supply chains and marketing.
What makes data analytics especially powerful is its adaptability. The same foundational skills working with Excel, SQL, and visualization tools like Power BI or Tableau are applied across almost every industry, making it one of the most versatile career paths today.
For beginners, these real-world applications provide more than just understanding; they offer clarity on how data-driven roles function in practice. Building this foundation is the first step toward roles like Data Analyst, Business Analyst, and BI Analyst, where interpreting data and turning it into actionable insights is a daily responsibility.
Sources & references:
-
USD 198.8 billion by 2033
https://www.grandviewresearch.com/industry-analysis/healthcare-analytics-market -
manufacturing analytics
https://www.weforum.org/stories/2022/09/manufacturing-data-advanced-analytics/
Digital Marketing Courses in Other Locations in India
Ahmedabad | Aurangabad | Bangalore | Bhilai | Bhopal | Bhubaneshwar | Chandigarh | Chennai | Cochin | Coimbatore | Dehra Dun | Delhi | Faridabad | Ghaziabad | Gorakhpur | Guntur | Gurgaon | Guwahati | Hyderabad | Jaipur | Kanpur | Khammam | Kolkata | Lucknow | Madurai | Mumbai | Mysore | Nagpur | Noida | Patna | Pondicherry | Pune | Ranchi | Shimoga | Surat | Thane | Thiruvananthapuram | Tiruchirappalli | Tirupati | Vadodara | Visakhapatnam | Warangal | Jalandhar | Jodhpur | Indore | Durgapur | Jamshedpur | Dhanbad | Kota | Karnal | Udaipur | Amritsar | calicut | Nashik | Ludhiana | varanasi | thrissur | Mangalore | Raipur |
-
 BhagathThanks for showcasing real-life examples of how data analytics is transforming industries and improving decision-making.