


What is Exploratory Data Analysis?
Learn what Exploratory Data Analysis (EDA) is, why it matters in 2025, and how to perform EDA using Python with real-world tools and best practices.

Did you know that by 2025, the global data sphere is projected to hit a staggering 181 zettabytes, up from just 2 zettabytes in 2010? The world of data is evolving at a breakneck pace—over 65% of organizations now leverage AI-powered analytics for real-time decision-making —and the big data market is projected to soar to $103 billion by 2027. As we navigate this data-drenched landscape, the ability to unlock actionable insights from these massive volumes isn’t just an advantage—it’s essential for survival.
From AI-driven automation to live data streams in industries like healthcare and finance, the demand for agile, robust tools to make sense of complex datasets has never been greater. Here’s where Exploratory Data Analysis (EDA) enters the spotlight. Often described as the "detective work" of data science, EDA is the first, crucial step in any strong analytics journey. It equips organizations, researchers, and curious minds alike to unravel hidden patterns, identify anomalies, and carve out pathways to innovation from the seemingly chaotic sea of information. If you’re ready to transform raw numbers into groundbreaking discoveries, you’re in the right place.
What is Exploratory Data Analysis?
Exploratory Data Analysis (EDA) refers to the art and science of dissecting datasets using visual methods, summary statistics, and an inquisitive mindset. The primary goal? To get an intimate understanding of your data, spotting outliers, identifying prominent trends, and challenging assumptions, all before running formal statistical tests or machine learning models. EDA is the data scientist’s way of “getting to know” the data, much like a chef tastes ingredients before deciding on a recipe.
EDA supplies the tools to:


-
Generate Statistical Summaries: Scan for means, medians, outliers, and missing values.
-
Reveal Visual Patterns: Use histograms, boxplots, and scatterplots to expose real data behavior.
-
Map Relationships: Identify how variables interact, cluster, or compete.
-
Spot Anomalies and Gaps: Unmask errors, outliers, and the unknowns that can quietly derail projects.
The Purpose of EDA
EDA is about asking the right questions and testing assumptions before running formal analytics or deploying AI models. It’s the vital first step in transforming scattered data into insights with impact.
Why Is EDA Important?
-
Builds Trust in Data: Thoroughly exploring your data ensures that any models or conclusions drawn later are built on solid ground.
-
Uncovers Hidden Insights: EDA often reveals unexpected patterns, relationships, or errors that could otherwise derail analysis.
-
Supports Hypothesis Generation: By visually and statistically summarizing data, EDA helps analysts form and sharpen research questions.
-
Prevents Costly Mistakes: Outliers, missing values, or data skew detected early can save months of headaches later in the project.
Key Components of EDA
EDA isn’t a single tool or method—it’s an iterative process. Here’s what a robust EDA journey includes:
Real-world data is never perfect. Missing values, typographical errors, and duplicate entries almost always lurk within. Step one is always to diagnose, quantify, and address these issues.
-
Missing Values: Visualize missingness matrices; decide to fill, drop, or impute.
-
Duplicates: Identify and remove redundant rows.
-
Inconsistent Types: Convert “2025-06-12” to datetime, or ‘yes/no’ strings to booleans.
2. Descriptive Statistics
Your first quick scan: What is the shape of your data?
-
Mean, Median, Mode: Central tendency.
-
Variance, Standard Deviation: How spread out is the data?
-
Skewness, Kurtosis: Are there long tails or anomalies?
3. Visualization
A good plot tells a story at a glance:
-
Histogram: How are ages or salaries distributed?
-
Boxplot: Are there salary outliers in the marketing team?
-
Scatter Plot: Does ad spending correlate with sales?


4. Relationship Analysis
-
Correlation Analysis: Do increases in feature X always bring increases/decreases in feature Y?
-
Cross-tabulations and Group-by Analysis: How do different categories in one variable break down across another?
5. Multivariate Analysis
-
Pair Plots: Multiple variables, many relationships, one dense visual.
-
Heatmaps: A Matrix of correlations can uncover clusters of tightly bound features.
Types of Exploratory Data Analysis
|
Type of EDA |
Focus |
Typical Techniques |
|
Univariate Analysis |
One variable at a time |
Histograms, box plots, summary stats |
|
Bivariate Analysis |
Relationship between two vars |
Scatter plots, correlation coefficients, cross-tabs |
|
Multivariate |
Multiple variables |
Pair plots, heatmaps, and dimensionality reduction |
|
Graphical Analysis |
Visual patterns and outliers |
Bar charts, violin plots, line plots |
|
Descriptive Stats |
Data summary |
Mean, median, variance, standard deviation |
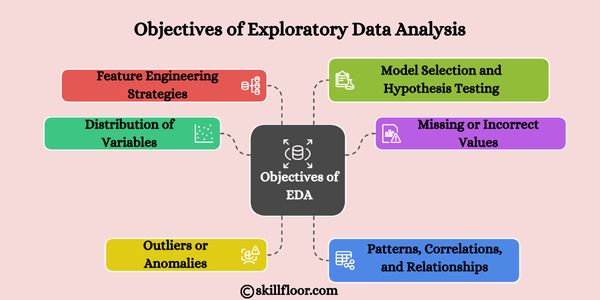
Objectives of EDA:
-
Understand the distribution of variables
-
Identify missing or incorrect values
-
Detect outliers or anomalies
-
Spot patterns, correlations, and relationships
-
Decide on feature engineering strategies
-
Guide model selection and hypothesis testing
Rather than jumping straight into machine learning algorithms or statistical models, EDA encourages data professionals to interact with the data, ask questions, and validate assumptions. Think of EDA as the investigative phase of your data journey, where you become the detective trying to make sense of the evidence.
How to Perform EDA Using Python: A Stepwise Guide
Python’s rich ecosystem makes it the perfect partner for EDA. Here’s how to get started:
1. Assemble Your Toolkit
Essential Python Libraries:
-
pandas: Data manipulation and analysis.
-
numpy: Numerical operations.
-
matplotlib & seaborn: Visualization.
-
plotly: Interactive charts.
-
missingno: Visualizing missing data.
-
ydata-profiling: Automatic EDA reports.
Install with:
pip install pandas numpy matplotlib seaborn plotly missingno ydata-profiling
2. Load Data and Initial Inspection
import pandas as pd
df = pd.read_csv('your_dataset.csv')
print(df.head())
print(df.info())
Tip: Use df.sample(10) for a random data snapshot.
3. Data Cleaning
Visualize and Handle Missing Data:
import missingno as msno
msno.matrix(df)
Remove duplicates:
print(df.duplicated().sum())
df = df.drop_duplicates()
Convert types:
df['date_column'] = pd.to_datetime(df['date_column'])
Impute missing values:
df.fillna(df.mean(numeric_only=True), inplace=True)
For categorical data:
df['category'].fillna(df['category'].mode()[0], inplace=True)
4. Descriptive Statistics
print(df.describe(include='all'))
print(df['city'].value_counts(dropna=False))
5. Visualizing Your Data
Distribution plots:
import seaborn as sns
sns.histplot(df['sales'], kde=True)
Categorical data:
sns.countplot(y='region', data=df)
Bivariate plots:
sns.scatterplot(x='marketing_spend', y='sales', data=df)
sns.boxplot(x='region', y='sales', data=df)
Interactive and Multivariate Plots:
import plotly.express as px
fig = px.scatter(df, x='age', y='income', color='gender', facet_col='region')
fig.show()
sns.pairplot(df[['age','income','spending_score','loyalty_score']], hue='gender')
Correlation Heatmap:
import matplotlib.pyplot as plt
plt.figure(figsize=(10,8))
sns.heatmap(df.corr(), annot=True, cmap='coolwarm')
plt.title('Correlation Matrix')
plt.show()
6. Pattern and Outlier Analysis
-
Crosstabs: Segmented statistics.
-
Boxplots and IQR: Isolate outliers.
sns.boxplot(x=df['order_value'])
Q1 = df['order_value'].quantile(0.25)
Q3 = df['order_value'].quantile(0.75)
IQR = Q3 - Q1
outliers = df[(df['order_value'] < Q1 - 1.5*IQR) | (df['order_value'] > Q3 + 1.5*IQR)]
print(f"We found {outliers.shape[0]} outliers.")
7. Feature Engineering
-
Binning: Group ages, incomes, etc.
-
Flags: High-value customers or risky behaviors.
-
Aggregations: Calculate customer lifetime value, average basket size.
df['age_group'] = pd.cut(df['age'], bins=[0,18,35,50,75,100], labels=['Teen','Young Adult','Adult','Senior','Elderly'])
8. Automated EDA Reporting
Instant reports:
from ydata_profiling import ProfileReport
profile = ProfileReport(df, title="EDA Report 2025", explorative=True)
profile.to_file("eda_report.html")
9. Document and Communicate Insights
EDA is as much about communication as discovery. Write clear, jargon-free summaries and ensure every chart answers a specific business question.
Best Practices for EDA
-
Start with a clear objective: Know what questions you're trying to answer.
-
Understand data types: Validate types before applying transformations.
-
Visualize before modeling: Plots often reveal patterns or issues you might miss.
-
Handle missing data thoughtfully: Impute, drop, or flag—but always document.
-
Detect and assess outliers: Use both statistical and domain knowledge.
-
Look for multicollinearity: Especially in regression settings.
-
Document insights continuously: Use Jupyter notebooks or markdown for reproducibility.
-
Validate assumptions: Don’t take distributions or relationships at face value.
-
Engage stakeholders: Share early insights visually to get feedback.
-
Use version control: Keep track of changes in datasets or cleaning steps.
Making EDA Count: Real-World Trends in 2025
As the industry evolves, EDA isn’t just about charts—it’s about integrating powerful AI tools, performing real-time analytics, and collaborating across decentralized data ecosystems. Some 2025 trends worth noting:
-
AI-powered EDA: Over 65% of organizations harness AI for EDA to automate outlier detection, anomaly spotting, and complex visualizations.
-
Data Mesh & Decentralization: Teams across companies work with self-serve data platforms, making EDA more democratized and dynamic.
-
Edge & Real-time Analytics: Especially in sectors like healthcare and finance, businesses now perform EDA on live data for immediate decision-making.
-
Data Privacy: As regulations tighten, EDA processes increasingly need to safeguard customer and business data at every step.
Learning to wield the power of Exploratory Data Analysis is like giving yourself X-ray vision in the world of data. In a data-centric world where AI and real-time analytics shape billion-dollar decisions, EDA is your compass—it keeps you oriented, helps you dodge pitfalls, and empowers bold, evidence-driven journeys.
Whether you’re a seasoned analyst or just taking your first bite of Python, mastering EDA means you’re not just riding the data wave—you’re shaping where it goes next. So pour yourself a fresh cup of curiosity, fire up your Python notebook, and start exploring. The next big insight could be just a plot or summary statistic away!