Advantages of Data Science
Struggling to predict trends or improve efficiency? Data science can help. Learn how it drives better decisions, personalization, and business growth.

Data science is an exciting field that I’ve been lucky to explore. It’s amazing how data—the information we produce every day—can be used to solve problems and make better decisions.
What Is Data Science?
Data science is all about finding useful information in data. Think of it like solving a puzzle. Companies and organizations use data science to understand patterns, predict what might happen next, and make smarter choices. For example, data science can help a business figure out which products people like the most or help doctors find better treatments for patients.
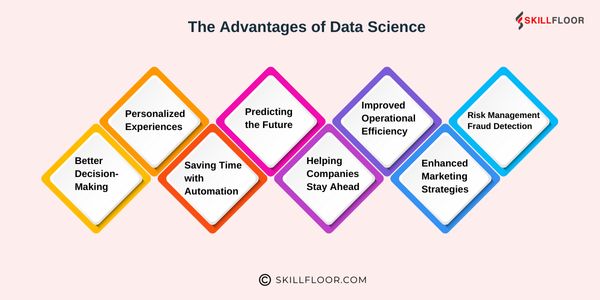
The Advantages of Data Science
Data science is becoming a big part of many industries. It helps people, businesses, and organizations make better decisions, save time, and predict what might happen in the future. Let's take a closer look at some of the key advantages of data science, with examples to make it easier to understand.
1. Better Decision-Making
One of the best things about data science is that it helps people make better decisions. Instead of guessing what will work, data science uses facts and numbers to guide choices. By looking at data from the past, businesses can find patterns and use that information to make smarter decisions in the future.
Examples:
-
Retail Industry: A store analyzes sales data to determine which products sell the most. This helps the store stock the right items so it doesn't waste money on things that aren't selling.
-
Healthcare: Doctors use data to make better decisions for patient care. For example, if a doctor sees signs in a patient’s data that suggest they are at risk for a disease, they can take action early to help the patient.
2. Personalized Experiences
Data science also helps businesses create personalized experiences for customers. By looking at what people like and what they've done before, businesses can give them things they will enjoy or find helpful. This makes the customer feel special and helps businesses keep their customers happy.
Example:
-
Netflix and YouTube Recommendations: Netflix suggests movies or shows based on what you’ve watched before, and YouTube does the same with videos. Netflix’s recommendation system accounts for over 80% of the content people watch on the platform.
-
Online Shopping: Amazon uses your previous searches and purchases to recommend products that might interest you, making it easier to find what you want. Amazon's personalized recommendation engine generates around 35% of its total sales.
3. Saving Time with Automation
Data science can make things easier by automating tasks. This means using machines or programs to do repetitive jobs without needing people to do them manually. This saves time for everyone involved.
Example:
-
Chatbots for Customer Service: Many websites use chatbots, which are AI tools that answer customer questions. These bots use data to respond quickly, saving time for both the company and the customer. Chatbots can handle 80% of customer inquiries, significantly reducing customer service costs.
-
Factory Robots: In factories, robots use data to do tasks like building products or packing them. They do these tasks much faster and more accurately than humans, helping companies increase production. Companies using robotics in manufacturing report a 30-40% reduction in operating costs.
4. Predicting the Future
One of the most exciting things about data science is its ability to predict what might happen in the future. By looking at past data, we can make good guesses about what will happen next. This helps businesses and people prepare for future events.
Example:
-
Weather Predictions: Weather apps, like those from AccuWeather or The Weather Channel, use data to predict if it will rain tomorrow. The accuracy of weather forecasts has increased by nearly 20% in the last 20 years due to advancements in data science and machine learning.
-
Stock Market Predictions: Investors use data science to predict how the stock market might move. By looking at past prices and trends, they can make decisions about where to invest. Seventy-three percent of financial firms use data analytics for investment management and portfolio optimization.
5. Helping Companies Stay Ahead
Data science helps businesses stay ahead of their competition. It allows them to spot new opportunities, find gaps in the market, and create products that customers will want.
Examples:
-
Competitive Analysis: Companies use data to see what their competitors are doing. For example, a company might track what products their competitors are selling and adjust their own products to stand out.
-
Identifying Market Gaps: Data science helps companies find areas where there is a need for new products. For example, if a company notices that a certain product is missing in the market, they can create that product and attract more customers.
6. Improved Operational Efficiency
Data science helps with decision-making and helps companies run more smoothly. By analyzing data, businesses can identify areas where they are wasting time or money and improve their processes.
Examples:
-
Supply Chain Optimization: Companies use data to track how products move from factories to stores. For example, Walmart uses data science to predict what products customers will want so it can ensure that it has enough stock at the right time.
-
Energy Efficiency: Companies use data to manage energy use better. For example, data can help factories predict when equipment will need maintenance, so they don’t waste energy by running machines that aren’t working properly.
7. Enhanced Marketing Strategies
Data science can improve marketing by helping businesses understand what their customers like and need. By analyzing data, companies can create marketing campaigns that reach the right people with the right message.
Examples:
-
Targeted Advertising: Companies like Facebook and Google use data science to show ads that are most likely to be interesting to you. They track your activity online and use that information to show you ads that match your interests.
-
Customer Segmentation: Businesses use data to group customers based on what they like. For example, a store might use data to group customers who like sports gear and send them promotions related to sports items.
8. Risk Management and Fraud Detection
Data science is also helpful in managing risks and preventing fraud. By analyzing data, businesses can spot unusual patterns that might show someone is trying to commit fraud or that something risky is happening.
Examples:
-
Credit Scoring: Banks use data science to determine whether a person is likely to pay back a loan. By looking at data about a person’s financial history, they can decide if they should lend money or not.
-
Fraud Detection: Credit card companies use data science to spot unusual purchases that might indicate fraud. For example, if a person’s credit card is used in a new country, the system might alert the company to check if it’s a real purchase.
How Data Science Helps in Different Fields
One thing I love about data science is that it’s used everywhere. Here are a few examples:
-
Healthcare: Doctors use data to predict diseases and create personalized treatments for patients. Data science could help prevent 30-50% of all healthcare-related errors, as reported by the National Institutes of Health (NIH).
-
Retail: Stores use data to manage stock and create better shopping experiences. Data-driven retail strategies can increase sales by as much as 10-15%.
-
Finance: Banks use data to detect fraud and keep your money safe. They also use it to decide who gets a loan. The global market for fraud detection in the financial sector is expected to reach $25 billion by 2027.
-
Entertainment: Platforms like Spotify and Netflix use data to recommend music and shows you might enjoy. Netflix saves an estimated $1 billion annually thanks to its recommendation algorithm.
-
Education: Schools use data to help students learn better. For example, they can track how well students are doing and offer extra help if needed. Institutions using data to track student performance have seen a 25% improvement in graduation rates.
Why Data Science Is Great for Students
Learning about data science can also be helpful for students. There are lots of jobs in this field, and companies are looking for people who know how to work with data. The U.S. Bureau of Labor Statistics reports that employment in data science and related fields is projected to grow by 35% between 2021 and 2031, much faster than most other professions.
Making It Visual
Sometimes, data science uses pictures like graphs or charts to show information. For example, a chart might show how sales go up when a company uses data to understand customers better. These visuals make it easier to understand complicated ideas.
1. Line Graph: Sales Growth Over Time
A line graph can show how sales change over time, especially after a company starts using data to understand customers.
Example:
-
X-Axis: Time (like months or years)
-
Y-Axis: Sales ($)
-
Line 1: Sales before using customer data
-
Line 2: Sales after using customer data
The line graph shows if sales go up when a company starts using data to understand what customers want.
2. Bar Chart: Customer Satisfaction
A bar chart can compare customer satisfaction before and after using data to improve services or products.
Example:
-
X-Axis: Customer Satisfaction (rating from 1 to 10)
-
Y-Axis: Number of customers
-
Bar 1: Customer satisfaction before using data
-
Bar 2: Customer satisfaction after using data
The bar chart can show if more customers are happy after the company uses data to improve what they offer.
3. Pie Chart: Sales by Customer Group
A pie chart can show what part of total sales comes from different customer groups, like new or returning customers.
Example:
-
Customer Groups: New customers, Old customers, High-value customers
-
Pie Chart: Each slice shows what percentage of total sales comes from each group.
The pie chart helps show which group is buying the most.
4. Scatter Plot: Marketing Spend vs. Sales
A scatter plot can show if spending more on marketing leads to higher sales.
Example:
-
X-Axis: Money spent on marketing ($)
-
Y-Axis: Sales ($)
-
Each dot shows a point where marketing and sales were recorded.
If the dots move from bottom-left to top-right, it means spending more on marketing is helping sales go up.
5. Heat Map: Website Clicks
A heat map shows which parts of a website are clicked the most by users.
Example:
-
X-Axis: Different website sections (homepage, product pages, checkout)
-
Y-Axis: How much people click or scroll
-
Colors: Red or yellow shows areas with more clicks, and blue means fewer clicks.
A heat map helps companies know which website parts are the most popular so they can make those areas better.
These examples show how charts and graphs make it easier to understand and use information. They help people see patterns, like how sales grow or which customers are most important.
Overcoming Challenges
Of course, there are challenges in data science, like making sure data is accurate or keeping it private. But with the right tools and ethical practices, these challenges can be solved. The key is to learn and grow in the field.
The Power of Data Science
Data science is changing the world in so many ways. It helps us make smarter decisions, personalize experiences, save time, and predict what might happen next. For businesses and individuals, it’s a tool that opens up endless possibilities.
If you’re interested in data science, now is the perfect time to explore it. Whether you want to solve big problems, make cool apps, or just understand the world better, data science can help you get there. So, why not dive in and see what you can discover?


