The Certified Tableau course offered by SkillFloor provides a comprehensive and structured approach to mastering Tableau, a leading data visualization tool. Tailored for both beginners and advanced users, this Tableau course covers essential concepts and techniques necessary to become proficient in data analysis and visualization using Tableau. With a focus on hands-on learning, participants are guided through various real-world scenarios and case studies to apply their skills effectively. Through this Tableau certification program, students gain the knowledge and confidence to tackle complex data visualization challenges and effectively communicate insights to stakeholders.
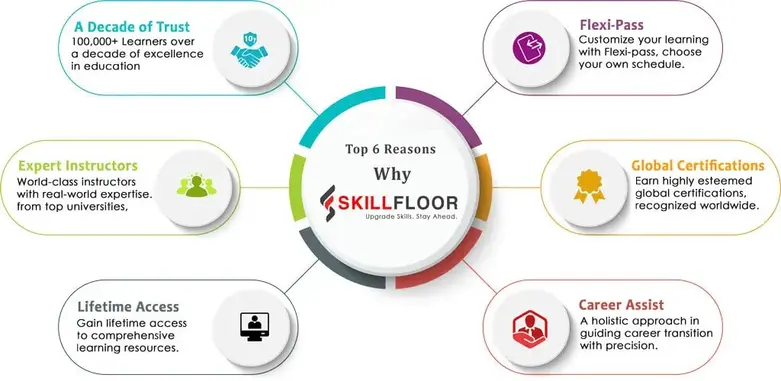
SkillFloor's Certified Tableau training stands out for its interactive and engaging online format, making it accessible to learners worldwide. The course curriculum is designed by industry experts and covers the latest features and functionalities of Tableau. Participants receive personalized guidance and support from experienced instructors throughout the tableau training, ensuring a high-quality learning experience. Upon completion of the program, students are equipped with the expertise and certification needed to excel in roles requiring advanced data analysis and visualization skills. Whether you're new to Tableau or seeking to enhance your proficiency, this course offers a valuable opportunity to expand your skill set and advance your career in data analytics.
₹60,000
Introduction to Tableau: This initial section acquaints students with Tableau's interface, fundamental features, and how it stands in the data visualization ecosystem.
Connecting to Data: Learners explore how to connect Tableau to various data sources, understanding the steps to import and manage data effectively.
Data Preparation: This part focuses on preparing data for analysis, including cleaning, transforming, and structuring data in Tableau.
Creating Visualizations: Students learn to create a range of visualizations, from basic charts to more complex graphical representations, to effectively convey data insights.
Dashboard and Storytelling: This module teaches the art of combining multiple visualizations into a dashboard and using storytelling techniques to present data compellingly.
Advanced Data Analysis: Here, learners delve deeper into more sophisticated data analysis techniques within Tableau, such as calculated fields and parameters.
Interactive Dashboards: Students explore how to make dashboards interactive with actions, filters, and tooltips to allow end-users to engage with data dynamically.
Best Practices for Design: This section covers the principles of effective visual design in Tableau, ensuring visualizations are not only informative but also aesthetically pleasing.
Publishing and Sharing: Learners are shown how to publish their dashboards and visualizations, sharing insights with others through Tableau Server or Tableau Public.
Preparation for Tableau Certification: The final part of the course focuses on preparing students for the Tableau Certification exam, covering exam format, tips, and practice questions.
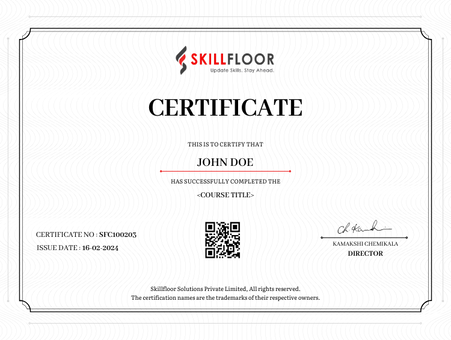
This Tableau certification shows that you're really good at using Tableau, a tool for understanding data in business. The program teaches you everything about connecting to data, getting it ready, and making it easy to understand. Once you're certified, it means you're great at creating dashboards (interactive info displays), telling interesting stories with data, and using Tableau's advanced features for smart analysis.Being a Certified Tableau Analyst means you know a lot about making decisions based on data, and turning raw information into useful insights. This certification proves you're skilled at using Tableau to make powerful visuals that help organizations make smart choices and stay ahead in the world of data. Having this certificate shows that you're an expert, and it lets you contribute to how businesses use data to make decisions.
Relevance to Industry: By providing training in a commonly used data visualisation technology, our Certified Tableau Analyst course guarantees that you have highly desired abilities in the data analytics industry.
Professional Growth: Achieve a respected certification that boosts your reputation and provides access to fascinating job options as a data visualisation expert or Tableau analyst.
Mastering data visualisation: will help you effectively communicate complicated data to stakeholders by teaching you how to produce visually appealing and insightful dashboards and reports in Tableau.
Advanced Analytics: To extract more insights from your data, become proficient in Tableau's advanced analytical features, such as calculations, parameters, and table calculations.
Productivity and Efficiency: With Tableau's robust capabilities and user-friendly interface, you can streamline your data analysis workflows and boost productivity when working on analytics projects.
Learn Tableau: how to use Tableau to link and combine data from many sources in a smooth manner for in-depth analysis and reporting.
Learn dynamic: interactive Tableau dashboards that enable users to dynamically explore data and draw conclusions.
Data Storytelling: Master the art of utilising Tableau to create captivating data tales that captivate and persuade stakeholders through your visual representations.
Collaboration and Sharing: Examine Tableau's tools for collaboration and sharing to promote cooperation and knowledge exchange inside your company.
Continuous Learning: Keep up with the most recent Tableau features and best practices by taking advantage of continuing education options, which will guarantee that your knowledge of the rapidly changing data analytics industry stays current.
Introduction to Tableau: Overview, Benefits, and Use Cases
Understanding Data Visualization: Concepts and Best Practices
Tableau Interface and Workspace Overview
Connecting to Various Data Sources (Excel, SQL, Cloud, etc.)
Data Importing and Extracting: Live vs. Extract Data Connections
Basic Chart Types: Bar, Line, Pie, and Heat Maps
Data Preparation: Cleaning, Pivoting, and Blending Data in Tableau
Filtering Data: Creating Filters, Quick Filters, and Interactive Filters
Sorting Data: Custom Sorts, Hierarchies, and Nested Sorting
Grouping and Binning Data: Creating Groups and Data Bins
Using Parameters: Customizing User Inputs and Dashboard Interaction
Cross-Tab View and Working with Metadata
Creating and Customizing Dual-Axis Charts and Combination Charts
Building Advanced Chart Types: Gantt Charts, Bullet Graphs, and Waterfall Charts
Utilizing Trend Lines, Forecasting, and Reference Lines
Data Highlighting and Conditional Formatting
Introduction to LOD (Level of Detail) Expressions: Fixed, Include, and Exclude
Working with Maps: Creating Symbol Maps, Filled Maps, and Custom Geographies
Basic Calculations: Creating Calculated Fields, Mathematical Operations
String Functions, Date Functions, and Logical Calculations in Tableau
Using Table Calculations: Running Totals, Percentages, and Ranking
Aggregating Data: SUM, AVERAGE, MIN, MAX, COUNT, and Aggregation Rules
Combining Aggregations and Calculations for Advanced Insights
Introduction to Statistical Functions and Analytics Pane
Building Interactive Dashboards: Layouts, Objects, and Formatting
Creating Effective Dashboards: Design Principles and Best Practices
Using Dashboard Actions: Filters, Highlights, and URL Actions
Designing for Mobile: Responsive Dashboards and Mobile Layouts
Embedding Web Content, External Applications, and Reports
Dashboard Optimization: Performance Tracking and Improving Load Times
Introduction to Tableau Prep: Data Flow and Cleaning in Prep
Data Shaping, Merging, and Joining Techniques in Tableau Prep
Creating Advanced Reports: Story Points and Use of Narratives
Data Security and Permissions: Publishing to Tableau Server/Online
Tableau Certification Preparation: Practice Exams and Key Tips
Project Presentation: Building a Comprehensive Tableau Dashboard for Certification
A certified Tableau analyst is someone who has completed a recognized certification program in Tableau, a data visualization tool, demonstrating proficiency in creating visualizations and analyzing data using Tableau software.
Becoming certified in Tableau can validate your skills, enhance your credibility as a data analyst, and increase your job prospects in fields where data visualization and analysis are important.
To become certified, you typically need to complete specific training courses, gain hands-on experience with Tableau, and pass an exam that tests your knowledge and proficiency in using the software.
Skills such as data visualization, data analysis, understanding of basic statistics, and proficiency in Tableau software are important for Tableau certification.
With Tableau certification, you can pursue roles such as data analyst, business analyst, data visualization specialist, or Tableau developer in various industries.
The time it takes to become certified varies depending on your prior knowledge and experience with Tableau, but it typically takes a few months of study and preparation.
Earning a Tableau certification can provide you with valuable skills and credentials that can help advance your career and open up new opportunities in the field of data visualization and analysis.