- High Job Demand: Gorakhpur’s growing presence in IT services, education, healthcare, banking, and emerging digital businesses is driving steady demand for skilled data analysts and business analysts.
-
Career Growth with Strong Earning Potential: Completing analytics training opens doors to rewarding roles in data analytics and business intelligence, with organizations across Gorakhpur and nearby cities actively hiring trained professionals.
-
Industry-Relevant Curriculum: The program is aligned with current industry expectations, focusing on modern analytics tools, practical techniques, and real job-oriented skills rather than outdated theory.
-
Expert-Led Training: Learn from experienced industry professionals who break down complex analytics concepts and share insights based on real-world projects and business use cases.
-
Hands-On Practical Learning: Work on real business case studies and analytics projects that help you confidently apply concepts in actual workplace scenarios.
-
Master In-Demand Tools: Develop strong skills in essential analytics tools such as Excel, Power BI, and Python, which are widely used across industries today.
-
Dedicated Career Support: Skillfloor provides complete career assistance, including resume building, mock interviews, and placement guidance, to help learners secure suitable roles.
-
Recognized Certification: Earn a Skillfloor analytics certification that boosts professional credibility and improves visibility in Gorakhpur’s and regional job markets.
-
Growing Alumni Network: Join Skillfloor’s expanding alumni community for peer learning, mentorship, and access to new career opportunities.
-
Excellent Value for Learners: Skillfloor offers a practical, industry-oriented Data Analytics course at an affordable fee of just ₹14,900. This cost-effective program provides hands-on training, real-world projects, and expert guidance to ensure strong career returns on your investment.
The Growing Influence of Business Analytics in Digital India
Business Analytics is playing a central role in shaping Digital India, as organizations increasingly rely on data-driven decision-making to improve efficiency, customer experience, and competitiveness. According to industry reports, India’s analytics and data science market is projected to grow at over 25 percent annually, with millions of analytics-related jobs expected to emerge by the end of the decade. Sectors such as IT services, banking, healthcare, retail, manufacturing, and e-commerce are actively using business intelligence, data visualization, and predictive analytics to optimize operations and support strategic planning. This shift highlights how analytics has moved from a support function to a core business capability.
As demand grows, companies are seeking professionals who can convert raw data into actionable insights using tools like Power BI, Tableau, SQL, and Python. This is where structured learning becomes important. Platforms like Skillfloor support India’s digital transformation by offering industry-aligned business analytics training, practical projects, and recognized certifications that help learners stay relevant in a competitive job market. By focusing on hands-on analytics skills, real-world use cases, and career readiness, Skillfloor helps aspiring professionals contribute meaningfully to the evolving Digital India ecosystem while building strong, future-ready careers.
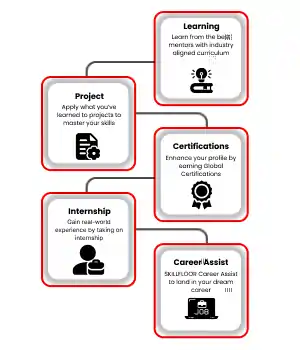
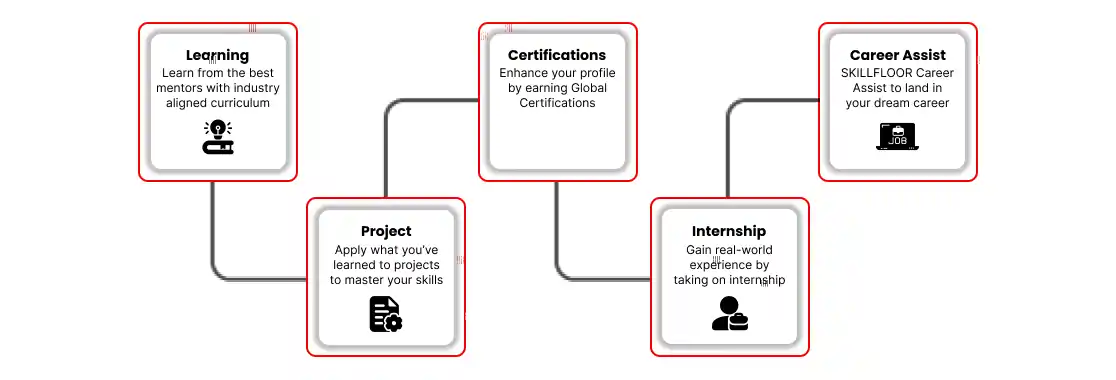
Skillfloor’s Data Analytics Program in Gorakhpur
The Data Analytics course in Gorakhpur at Skillfloor is designed to provide learners with a comprehensive, hands-on learning experience that balances theory with practical application. The program is structured to fit different learning needs, whether you are a fresh graduate, working professional, or career switcher. Through a combination of guided lessons, project-based exercises, and real-world case studies, students gain expertise in data analysis, visualization, predictive modeling, and machine learning. The course offers flexible learning options, allowing learners to complete it in an intensive two-month track for rapid skill development, a three- to five-month schedule for working professionals, or a self-paced format for maximum flexibility.
Throughout the program, learners work on live datasets, build dashboards, and create predictive models that reflect real business scenarios, ensuring they develop both technical skills and analytical thinking. By the end of the course, participants emerge with a strong portfolio demonstrating their ability to generate actionable insights and make data-driven decisions. Combined with mentorship and career guidance, Skillfloor’s program equips learners in Gorakhpur to confidently take on roles such as Data Analyst, BI Analyst, or Analytics Consultant, fully prepared to meet the demands of India’s fast-growing analytics job market.
Skillfloor’s Mentor-Led Approach to Analytics Learning
Skillfloor’s analytics training is built around a mentor-led learning model that focuses on practical understanding and real-world application. Instead of passive learning, students are guided by experienced data analysts who bring industry knowledge into every session. Mentors simplify complex analytics concepts, explain how they are applied in business settings, and support learners throughout the training journey.
Industry studies show that over 70 percent of companies in India prefer candidates with project-based analytics experience. Skillfloor’s mentor-driven approach directly addresses this demand by training learners the way professionals actually work. The emphasis is on applying knowledge, not just understanding theory.
How the Mentor-Led Model Benefits Learners
-
Guidance from industry experts who explain concepts clearly and relate them to real business use cases
-
Hands-on learning using real datasets instead of pre-built examples
-
Step-by-step project mentoring to help learners build confidence while solving analytics problems
-
Personalized feedback and support to improve technical and analytical skills
Learning by Doing with Real Business Exposure
Skillfloor strongly emphasizes learning by doing. Learners actively work on:
-
Data cleaning and analysis using real-world datasets
-
Dashboard creation with tools like Tableau and Power BI
-
Case studies that reflect actual business challenges and decision-making scenarios
This practical exposure ensures learners develop both technical skills and problem-solving ability.
Career-Focused Outcomes
Whether your goal is to become a Data Analyst, Tableau Analyst, Power BI Analyst, or move into advanced analytics roles, Skillfloor’s mentor-led approach prepares you with:
-
Practical experience aligned with industry expectations
-
Confidence to handle real analytics tasks
-
Clear understanding of how analytics supports business decisions
By combining expert mentorship with project-based learning, Skillfloor helps learners build industry-ready skills and move forward in their analytics careers with clarity and confidence.
Data Analytics Course Fee Structure in Gorakhpur
-
Basic/Short-Term Courses (1–3 Months): ₹15,000–₹40,000
-
Advanced Certificate Courses (3–6 Months): ₹30,000–₹180,000
-
Post-Graduate/Diploma Programs (6–12 Months): ₹120,000–₹600,000
-
Executive/Master’s Programs (12–18 Months): ₹400,000–₹900,000
Skillfloor Course Fee Structure:
Skillfloor’s Data Analytics course fee in Gorakhpur is competitively priced at ₹14,900, offering certified professional programs with hands-on projects, live training, internship opportunities, and dedicated career support—making it a cost-effective choice for students and working professionals.
-
Certified Data Analysis Professional: ₹14,900 (discounted from ₹60,000) — 2 months + 1-month internship.
-
Certified Business Analytics Professional: ₹14,900 (discounted from ₹60,000) — 2 months + 1-month internship.
-
Certified Power BI Analyst: ₹14,900 (discounted from ₹60,000) — 2 months + 1-month internship.
-
Certified Tableau Analyst: ₹14,900 (discounted from ₹60,000) — 2 months + 1-month internship.
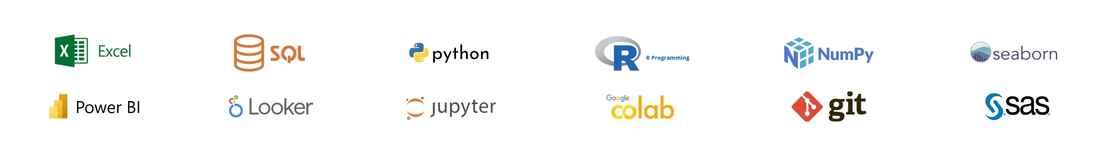
Top Analytics Tools and Technologies You Will Master
Skillfloor’s analytics programs cover essential tools and technologies that companies use every day. The training is practical and designed to help beginners and professionals build strong analytical skills.
-
Excel and Advanced Excel: Learn data cleaning, formulas, dashboards, pivot tables, and automation techniques that form the foundation of analytics.
-
SQL for Data Analysis: Develop skills in writing queries, filtering data, joining tables, and managing databases used in every analytics role.
-
Power BI: Create business intelligence dashboards, learn data modeling, use DAX functions, and build reports for real-time insights.
-
Tableau: Design dashboards, visualize complex datasets, and use visual storytelling to communicate insights effectively.
-
Python for Analytics: Work with data manipulation, visualization, and introductory machine learning through libraries such as Pandas, NumPy, and Matplotlib.
-
Statistics and Business Analytics: Understand core statistical concepts, forecasting methods, hypothesis testing, and business metrics used for decision-making.
Top Job Roles You Can Explore After Completing a Data Analytics Course
- Data Analyst: Data Analysts work with datasets to identify trends, patterns, and insights that support better business decisions. They play a key role in helping organizations improve efficiency, performance, and planning across departments.
- Business Analyst: Business Analysts focus on understanding business needs and using analytics to recommend process improvements and strategic solutions. This role bridges the gap between data insights and real business actions.
- Business Intelligence (BI) Analyst: BI Analysts specialize in building dashboards, reports, and visualizations using tools like Power BI or Tableau. Their work helps leadership teams track performance and make informed decisions quickly.
- Reporting Analyst: Reporting Analysts manage data reports, MIS dashboards, and performance summaries for various teams. They ensure information is accurate, timely, and presented in a clear, easy-to-understand format.
- Analytics Consultant: Analytics Consultants use data insights to advise organizations on improving operations, marketing, finance, or customer strategies. They often work closely with stakeholders to solve business problems using analytical approaches.
Start Your Data Analytics Journey in Gorakhpur Today
Gorakhpur, located in eastern Uttar Pradesh, is emerging as a key center for education, business, and technology. With its growing industrial and commercial ecosystem, the city offers an excellent environment for learning and career development. Gorakhpur’s evolving infrastructure and progressive outlook make it an ideal destination for individuals seeking a top Data Analytics Institute in Gorakhpur and promising career opportunities. The city’s focus on technology adoption and innovation creates the perfect space for aspiring data analytics professionals to thrive.
Our Data Analytics courses in Gorakhpur are designed to equip learners with the latest tools, techniques, and industry-relevant practices, ensuring they remain competitive and future-ready. Skillfloor offers specialized programs in Data Science, Data Analytics, Artificial Intelligence, Machine Learning, Data Engineering, and Python Programming, catering to beginners, students, and working professionals. For those interested in advanced roles in AI, Skillfloor’s Artificial Intelligence Course in Gorakhpur provides in-demand skills for high-growth opportunities. Additionally, professionals looking to expand their expertise can explore Skillfloor’s Digital Marketing Course in Gorakhpur, covering SEO, social media marketing, Google Ads, content strategy, and analytics-driven marketing with hands-on training and placement support.