-
Growing Analytics Career Opportunities: Bhubaneshwar’s expanding IT services, government digital initiatives, education sector, and emerging startup ecosystem are creating strong demand for data analysts and business intelligence professionals, offering consistent career growth and stability.
-
High-Paying Job Prospects: Skillfloor’s industry-ready analytics training prepares learners for well-paying roles in data analytics, business analytics, BI development, and reporting across reputable organizations.
-
Expert-Curated Curriculum: The program follows an industry-focused syllabus aligned with current market needs, covering essential analytics tools, real-world case studies, and practical workflows.
-
Training by Industry Specialists: Learn from experienced analytics and BI professionals who bring real-world insights, hands-on expertise, and industry best practices into every session.
-
Practical, Real-World Exposure: Gain hands-on experience through live datasets, business case studies, and projects that help you confidently solve real business challenges.
-
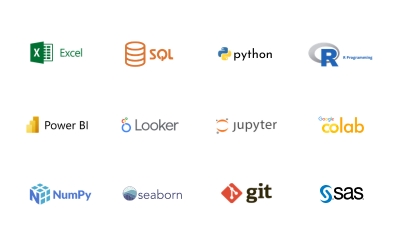
Proficiency in Key Analytics Tools: Master in-demand tools such as Excel, SQL, Python, Power BI, and Tableau, giving you a competitive edge in Bhubaneshwar’s growing analytics job market.
-
Comprehensive Career Support: Receive resume-building assistance, mock interviews, and placement support to prepare for analytics roles in Bhubaneshwar and other major cities.
-
Industry-Recognized Certification: Earn a Skillfloor Analytics Certification that enhances your professional credibility and strengthens your profile with employers.
-
Supportive Learning Community: Become part of Skillfloor’s active learner and alumni network, enabling mentorship, peer collaboration, and job referral opportunities.
-
Affordable & High-Value Training: Skillfloor offers a practical, industry-oriented Data Analytics course at an affordable fee of just ₹14,900. This cost-effective program provides hands-on training, real-world projects, and expert guidance to ensure strong career returns on your investment.
Scope of Business Analytics Careers in India
The scope of business analytics careers in India has expanded steadily as organizations place greater emphasis on using data to support planning, operations, and decision-making. Industry reports indicate that the analytics market in India is expected to grow at a compound annual growth rate (CAGR) of around 30% through 2028, driven by adoption across sectors such as BFSI, retail, healthcare, manufacturing, and IT services. Demand remains strong for roles like business analyst, data analyst, BI developer, and analytics consultant, with job portals listing over 50,000 active analytics openings across cities, including Bangalore, Mumbai, Delhi NCR, and Pune. Employers increasingly value professionals who can combine analytical skills with business understanding.
Business analytics continues to offer dependable career opportunities with strong earning potential across India. Entry-level professionals typically earn between ₹4 and ₹8 lakh per annum, while mid-level and senior roles, such as senior business analyst or analytics manager, can reach ₹12–₹20 lakh or higher, depending on experience and domain expertise. Organizations across sectors are investing in analytics capabilities to improve efficiency and decision quality, making skilled professionals an important part of long-term business planning. This has also increased the demand for practical training and industry-recognized certifications that help professionals build relevant skills and advance their careers.
Business Analytics Skills That Deliver Long-Term Career Value
Business analytics is built on skills that remain relevant across industries and roles. While tools and technologies may change, the ability to understand data, interpret insights, and support business decisions continues to hold strong value. Professionals who develop a solid analytics foundation are better prepared to adapt to new tools, business models, and industry requirements over time. These skills not only support immediate job opportunities but also enable sustained career growth.
Core skills that create lasting career value include:
-
Data Analysis and Interpretation: The ability to examine datasets, identify patterns, and translate findings into meaningful business insights is central to business analytics roles. This skill supports decision-making across finance, operations, marketing, and strategy functions.
-
Statistical Thinking: Understanding statistics helps professionals validate assumptions, assess risk, and evaluate outcomes. Concepts such as probability, correlation, and hypothesis testing provide a strong analytical foundation that remains useful regardless of industry or role.
-
Business Problem-Solving: Business analytics goes beyond working with data. It focuses on understanding business challenges, defining clear objectives, and selecting the right performance measures to guide decision-making. By translating insights into practical recommendations aligned with organizational goals, professionals play a stronger role in supporting strategy, improving processes, and influencing outcomes across teams.
-
Data Visualization and Storytelling: Communicating insights clearly through dashboards and visual reports is essential. Tools like Power BI and Tableau help transform complex data into understandable narratives that support executive decisions.
-
Technical Tool Proficiency: Knowledge of tools such as Excel, SQL, and Python supports data handling, automation, and analysis. These tools form the backbone of analytics work and are widely used across sectors.
-
Adaptability and Continuous Learning: Analytics professionals who stay open to learning new methods, tools, and domain knowledge remain valuable over time. This mindset allows individuals to grow into advanced roles such as senior analyst, analytics consultant, or analytics manager.
Together, these business analytics skills provide a strong and flexible foundation for long-term career development. Professionals who invest in building both analytical and business-oriented capabilities are better positioned to grow with organizations, take on leadership responsibilities, and sustain career relevance in an increasingly data-focused business environment
Why Choose Bhubaneshwar for Data Analytics Training?
Bhubaneshwar is steadily establishing itself as a promising center for technology, education, and professional growth in Eastern India. With increasing digital adoption across enterprises, public sector initiatives, and emerging businesses, the city offers strong potential for learners pursuing data analytics training with Skillfloor. Supported by reputed institutions, IT parks, and a growing innovation ecosystem, Bhubaneshwar provides a solid foundation for building analytics careers. Here are the key reasons to choose Skillfloor’s Data Analytics Training in Bhubaneshwar:
-
Expanding IT and Startup Ecosystem: Bhubaneshwar hosts a growing number of IT companies, startups, and technology-driven enterprises across sectors such as healthcare, fintech, education, and government services. These organizations increasingly rely on analytics to improve efficiency, planning, and decision-making, creating consistent demand for skilled data analytics professionals.
-
Growing Industrial and Service Sectors: The city’s industries and services include manufacturing, infrastructure, healthcare, education, and public administration. As these sectors adopt analytics tools for performance monitoring and planning, trained data analytics professionals from Skillfloor are well-positioned to support business and operational goals.
-
Career Opportunities Across Multiple Roles: Learners trained by Skillfloor in Bhubaneshwar can explore roles such as data analyst, business analyst, Power BI analyst, and analytics consultant. The program is suitable for fresh graduates as well as working professionals seeking structured upskilling and career advancement.
-
Attractive Compensation Potential: Analytics professionals in Bhubaneshwar benefit from competitive salary opportunities, especially as demand continues to grow. Certified candidates with practical skills and hands-on project experience often gain an advantage in securing better roles and compensation.
-
Access to Regional and National IT Markets: Bhubaneshwar’s connectivity to cities like Kolkata, Visakhapatnam, and Hyderabad expands career opportunities beyond the local market. With Skillfloor’s offline and practical data analytics training, learners can build job-ready skills and confidently pursue analytics roles across multiple regions.
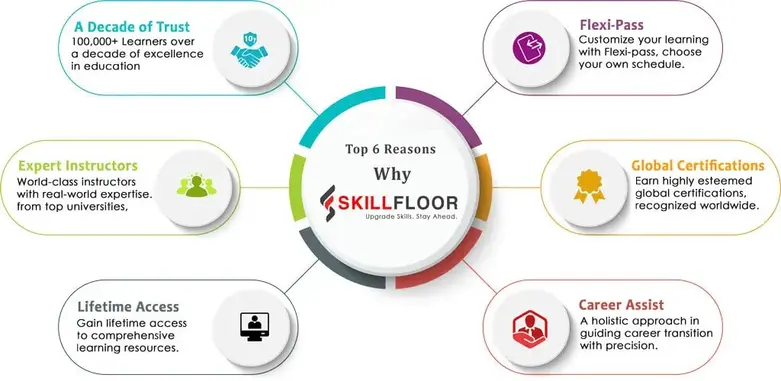
Why Skillfloor is the Right Choice for Data Analytics Training in Bhubaneshwar
Skillfloor is a trusted data analytics training institute in Bhubaneshwar, offering industry-aligned programs that focus on building practical skills and job-ready expertise. Designed for both students and working professionals, Skillfloor’s training approach helps learners gain confidence and real-world exposure. Here is what makes Skillfloor the right choice:
-
Industry-Recognized Certification: Skillfloor offers certifications that are valued by analytics and IT employers, helping learners strengthen their professional profiles and stand out during job applications.
-
Instructor-Led Offline Training: Skillfloor provides offline data analytics classes in Bhubaneshwar for learners who prefer classroom-based, mentor-guided learning with direct interaction and personalized support.
-
Experienced Industry Mentors: Sessions are led by professionals with hands-on industry experience who share practical insights, best practices, and real use cases beyond textbook concepts.
-
Hands-On, Project-Based Learning: The training emphasizes practical exposure through live datasets, real-world case studies, capstone projects, and tool-based assignments that reflect actual business scenarios.
-
Flexible Learning Modes: Learners can choose between offline and online data analytics courses in Bhubaneshwar, allowing them to balance learning with academic, professional, or personal commitments.
-
Career and Placement Support: Skillfloor’s career support includes resume development, interview preparation, and job assistance, helping learners transition confidently into analytics and business intelligence roles.
This structured learning approach ensures that learners in Bhubaneshwar gain not only conceptual knowledge but also the practical skills and career readiness needed to succeed in the analytics field.
Data Analytics Course Fee Structure in Bhubaneshwar
-
Basic/Short-Term Courses (1–3 Months): ₹15,000–₹40,000
-
Advanced Certificate Courses (3–6 Months): ₹30,000–₹180,000
-
Post-Graduate/Diploma Programs (6–12 Months): ₹120,000–₹600,000
-
Executive/Master’s Programs (12–18 Months): ₹400,000–₹900,000
Skillfloor Course Fee Structure:
Skillfloor’s Data Analytics course fee in Bhubaneshwar is competitively priced at ₹14,900, offering certified professional programs with hands-on projects, live training, internship opportunities, and dedicated career support—making it a cost-effective choice for students and working professionals.
-
Certified Data Analysis Professional: ₹14,900 (discounted from ₹60,000) — 2 months + 1-month internship.
-
Certified Business Analytics Professional: ₹14,900 (discounted from ₹60,000) — 2 months + 1-month internship.
-
Certified Power BI Analyst: ₹14,900 (discounted from ₹60,000) — 2 months + 1-month internship.
-
Certified Tableau Analyst: ₹14,900 (discounted from ₹60,000) — 2 months + 1-month internship.
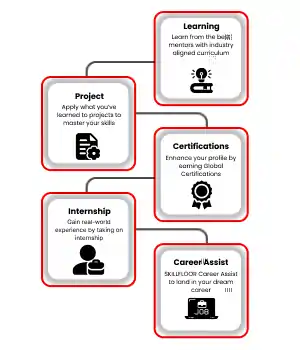
Structured Learning Approach for Data Analytics Skill Development
A well-designed data analytics training program follows a systematic learning approach that helps learners build strong technical knowledge along with practical industry skills. The training process focuses on combining theoretical understanding with hands-on experience to prepare individuals for real-world data analytics roles.
-
Building a Strong Conceptual Foundation: The learning journey begins with essential data analysis concepts, along with core data fundamentals. Learners are introduced to analytical thinking, data structures, statistical methods, and basic tools through guided sessions and structured modules. This stage ensures participants understand how data is collected, organized, analyzed, and interpreted within business environments before progressing to advanced topics, including introductory machine learning concepts.
-
Hands-On Practice with Real-World Applications: Once foundational knowledge is established, learners move into practical training using real datasets and business case studies. Sessions emphasize working with industry-relevant tools such as Excel, SQL, Python, and Power BI. Practical exercises and assignments help learners apply concepts effectively while developing problem-solving and data interpretation skills.
-
Career Preparation and Industry Readiness: The final phase focuses on preparing learners for professional opportunities in data analytics. Participants work on capstone projects that simulate real business challenges and strengthen their professional portfolios. Career-focused guidance, including resume development and interview preparation, helps learners confidently transition into data analytics roles across various industries.
This structured learning methodology ensures learners gain technical expertise, analytical thinking abilities, and practical exposure to data analysis and machine learning, enabling success in today’s data-driven job market.
Transform Your Future with Data Analytics at Skillfloor
Bhubaneshwar, the capital city of Odisha, is widely recognized for its educational institutions, thriving industries, and progressive business environment. With a growing presence of IT services, healthcare, government organizations, and private enterprises, the city provides an encouraging ecosystem for learning, upskilling, and long-term career growth. Bhubaneshwar’s emphasis on technology adoption and modern business practices has created abundant opportunities for analytics professionals, making it an ideal destination for individuals seeking a quality Data Analytics Institute in Bhubaneshwar.
Skillfloor’s Data Analytics courses in Bhubaneshwar are structured to equip learners with industry-relevant tools, practical techniques, and the expertise needed to stay competitive. Skillfloor offers specialized programs in Data Science, Data Analytics, Artificial Intelligence, Machine Learning, Data Engineering, and Python Programming, catering to beginners, students, and working professionals. For those aiming to advance into AI-focused careers, Skillfloor’s Artificial Intelligence Course in Bhubaneshwar provides specialized skill-building for high-demand roles. Additionally, learners seeking to expand beyond analytics can explore Skillfloor’s Digital Marketing Course in Bhubaneswar, covering SEO, social media marketing, Google Ads, content strategy, and analytics-driven marketing, supported by hands-on training and placement assistance.