Skillfloor’s Certified Power BI Analyst Course is designed to deliver practical learning, real-world experience, and complete career support, all in one program. It focuses on building hands-on Power BI skills and real-world analytics understanding needed in today’s data-driven industry. Here are the top reasons why this course is the right choice to build a successful career in data analytics and business intelligence:
1. What You Will Learn: Advanced Power BI Training Program
At Skillfloor, the Certified Power BI Analyst program is designed to build strong practical skills in business intelligence, data analysis, and interactive dashboard development using Microsoft Power BI. The focus is on preparing learners to work with real business data and convert it into meaningful insights for decision-making.
-
Power BI Fundamentals: Understand the Power BI ecosystem, interface, and workflow used in professional data analysis environments.
-
Data Import & Integration: Learn how to connect and work with multiple data sources such as Excel, databases, and cloud systems.
-
Data Cleaning & Transformation: Use Power Query to prepare, structure, and transform raw data for accurate reporting.
-
Data Modeling Concepts: Build relationships between datasets and understand how structured models support better analysis.
-
DAX & Calculations: Learn basic to advanced DAX concepts to create measures, calculated fields, and business logic.
-
Dashboard Development: Create interactive dashboards using charts, visuals, filters, slicers, and KPI elements.
-
Data Visualization Techniques: Present data in clear visual formats that help identify trends, patterns, and performance metrics.
-
Power BI Service & Sharing: Understand how reports are published, shared, and managed in cloud-based Power BI environments.
-
Real-Time Analytics Practice: Work on practical datasets to understand how reporting is used in real business scenarios.
2. Skills You Will Gain: Analytical Thinking Skills
Develop strong, job-ready Power BI and business intelligence skills used in real analytics and reporting environments. This program helps you work with business data and convert it into structured dashboards for decision-making.
-
Data Visualization Skills: Present business data in clear and interactive visual formats using Power BI.
-
Dashboard Development Skills: Build structured dashboards with meaningful layouts and organized reporting flows.
-
Power Query Skills: Clean, reshape, and prepare raw data for analysis.
-
DAX Skills: Create calculations and business logic for advanced reporting needs.
-
Data Modeling Skills: Structure relationships between multiple datasets for accurate analysis.
-
Reporting Skills: Design interactive reports using visuals, filters, and slicers.
-
Data Integration Skills: Bring data from different sources into a unified reporting model.
-
Insight Generation Skills: Identify useful business patterns and trends from data.
-
Performance Handling Skills: Ensure smooth dashboard performance while working with large datasets.
-
Business Mapping Skills: Convert business requirements into effective reporting solutions.
3. Power BI Course Fee Structure in India (2026)
-
Basic Power BI Courses (1–3 Months): ₹15,000 – ₹35,000
-
Advanced Certification Courses (3–6 Months): ₹35,000 – ₹1,50,000
-
Professional / Diploma Programs (6–12 Months): ₹80,000 – ₹3,00,000
-
Executive Data Analytics Programs (12+ Months): ₹2,00,000 – ₹6,00,000
Skillfloor Course Fee Structure:
Skillfloor’s Certified Power BI Analyst Course is priced at just Rs. 14,900, offering hands-on Power BI training, real-world dashboard projects, internship exposure, certification, and career support, making it one of the most affordable professional programs for data analytics and business intelligence in India.
4. Tools & Platforms You Will Learn in Power BI
In Skillfloor’s Certified Power BI Analyst Course, you will work with industry tools used for building reports, analyzing data, and delivering business insights in real environments.
-
Power BI Desktop: Create interactive dashboards and visual reports from raw data.
-
Power BI Service: Publish reports online and manage access for sharing insights.
-
Power Query Editor: Perform data cleaning, shaping, and restructuring tasks.
-
DAX Engine: Write formulas for calculations and business logic.
-
Excel Integration: Use spreadsheets as data sources for analysis and reporting.
-
SQL Connections: Pull structured data directly from databases for reporting.
-
Data Gateway: Enable secure connection between local data sources and cloud reports.
-
Custom Visual Library: Enhance dashboards with advanced visualization components.
-
Workspace Management: Organize reports and datasets in collaborative environments.
5. Course Outcomes: What You Can Achieve with Power BI
After completing Skillfloor’s Certified Power BI Analyst Course, you will gain practical skills and real-world experience needed to work confidently in data analytics and business intelligence roles. The course focuses on hands-on learning, helping you understand how businesses use Power BI to analyze data and make better decisions.
Key Achievements
-
Learn how to create interactive dashboards and visual reports that turn raw data into clear business insights.
-
Understand how to analyze business data, identify trends, and present information in a simple and meaningful way.
-
Gain practical experience in working with datasets, building reports, and managing data inside Power BI.
-
Develop hands-on skills in Power Query, DAX, filters, KPIs, and dashboard creation used in real analytics projects.
-
Learn how companies use Power BI for sales tracking, performance monitoring, and business reporting.
-
Build a strong portfolio with real-world Power BI projects that help you stand out in data analytics and business intelligence job roles.
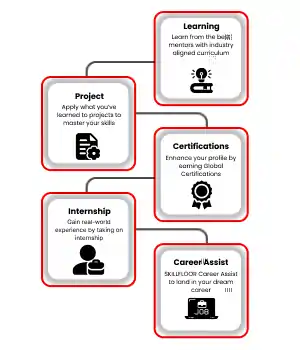
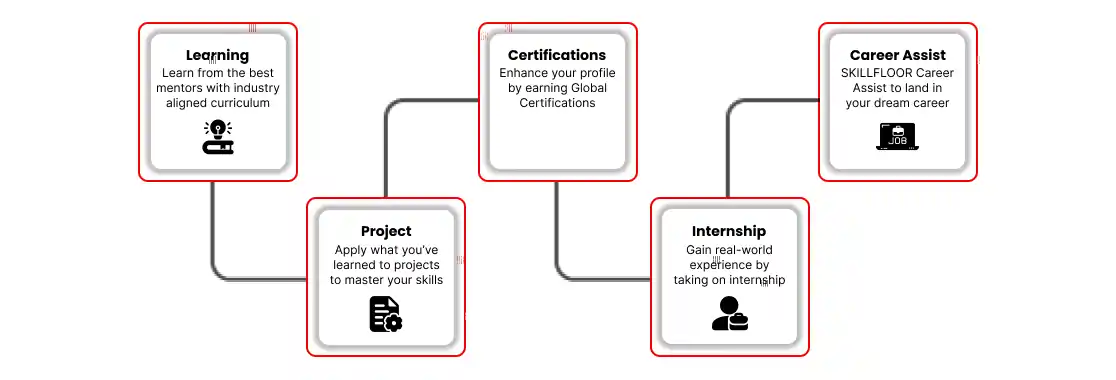
6. Course Highlights & Career Support
-
Placement Support: Get 100% placement assistance with resume building, portfolio preparation, interview support, and connections with hiring companies in data analytics and business intelligence roles.
-
Certification: Earn Skillfloor’s Certified Power BI Analyst certification, along with FutureSkills Prime and NASSCOM recognition and a LinkedIn-shareable certificate.
-
Internship: Work on real-world reporting and dashboard projects through a 1-student–1-project approach, gaining practical exposure to business analytics environments.
-
Course Details: Learn Power BI reporting, dashboard creation, data visualization, Power Query, DAX, data modeling, and business intelligence concepts.
-
Course Duration: 6 weeks of practical training followed by 6 weeks of hands-on internship with real-time business reporting projects.
-
Training Methods: Learn through online, offline, and hybrid modes with assignments, live projects, case studies, and practical sessions.
-
Career Services: Includes mock interviews, career mentoring, resume support, portfolio development, and LinkedIn profile optimization for analytics careers.
7. AI Role in Power BI: The Future of Smart Reporting
Skillfloor’s Certified Power BI Analyst Course helps you understand how organizations use business intelligence tools to simplify complex data and support better business decisions. The program focuses on practical analytics learning that matches current industry requirements and reporting workflows used in real companies.
What You Will Explore in This Program
-
Visual Business Reporting: Learn how to present business information through clear dashboards, charts, and interactive reports.
-
Data Interpretation Techniques: Understand how to read business data, identify patterns, and convert information into useful insights.
-
Reporting Workflow Understanding: Explore how reporting systems are used for tracking sales, operations, and business performance.
-
Business-Focused Dashboarding: Learn how professional dashboards are structured for decision-making and performance analysis.
Why This Learning Matters
-
Growing Demand Across Industries: Power BI professionals are needed in IT, finance, healthcare, retail, consulting, and many other sectors.
-
Practical Analytics Exposure: Gain experience working with reporting environments and business-focused datasets.
-
Career Opportunities in Analytics: Build a strong foundation for roles related to reporting, visualization, business intelligence, and data analysis.
8. Job Roles, Salary & Career Growth
Skillfloor’s Certified Power BI Analyst Course prepares you for core industry roles in data analytics, reporting, and business intelligence, where professionals work with business data to support decision-making and performance tracking.
-
Power BI Analyst: Work on building dashboards, reports, and data models to convert raw business data into clear visual insights for decision-making.
Salary: Entry-level professionals typically earn ₹4 – ₹8 LPA, depending on skills and project exposure.
-
Business Intelligence (BI) Analyst: Analyze business data and create reporting solutions that help organizations track performance and improve strategies.
Salary: Average range is ₹5 – ₹10 LPA, based on analytics and BI expertise.
-
Data Analyst: Collect, organize, and interpret business data to identify trends, patterns, and insights for business improvement.
Salary: Typically ranges from ₹4 – ₹9 LPA, depending on technical and analytical skills.
-
Reporting Analyst / MIS Analyst: Prepare structured reports, dashboards, and performance summaries for different business departments.
Salary: Usually between ₹3 – ₹7 LPA, based on reporting accuracy and tools knowledge.
Future Growth Opportunities
-
Expanding Career Scope: Organizations across multiple sectors are increasing investments in reporting and business intelligence solutions.
-
Flexible Industry Opportunities: Reporting and visualization knowledge can be applied in finance, healthcare, retail, operations, and consulting environments.
-
Professional Advancement: Over time, professionals can move into leadership positions such as Reporting Lead, BI Consultant, Analytics Strategist, or Insights Manager.
9. Skillfloor Power BI Courses List
-
Certified Data Analysis Professional
-
Certified Business Analytics Professional
-
Certified Tableau Analyst
10. Topics Covered / Syllabus in Certified Power BI Analyst Course
The Certified Power BI Analyst Course at Skillfloor is designed to provide complete, hands-on learning in data analytics, reporting, and business intelligence, with a strong focus on real-world business applications.
-
Introduction to Power BI & Business Intelligence: Understand the basics of Power BI, its role in business intelligence, and how organizations use data for decision-making.
-
Data Preparation & Power Query: Learn how to clean, transform, and prepare raw data for accurate reporting and analysis.
-
Data Modeling & Relationships: Build structured data models by connecting multiple datasets and creating meaningful relationships.
-
DAX (Data Analysis Expressions): Learn formulas and functions to perform calculations, create measures, and generate deeper business insights.
-
Data Visualization & Dashboard Design: Create interactive dashboards using charts, graphs, KPIs, and filters for clear business reporting.
-
Business Reporting Techniques: Develop professional reports for tracking sales, performance, operations, and business growth.
-
Data Connectivity & Integration: Connect Power BI with different data sources like Excel, databases, and business systems.
-
Performance Optimization & Dashboard Efficiency: Improve dashboard speed, accuracy, and usability for better business decision-making.
-
Real-Time Business Projects: Work on practical datasets to build dashboards and reports based on real business scenarios.
-
Internship & Practical Implementation: Apply your learning through hands-on projects and internship-style training focused on real reporting work.
Skillfloor’s Certified Power BI Analyst Course builds strong practical expertise in data analytics and business intelligence through hands-on learning and real-world projects. By the end of the program, you are prepared to confidently work with business data, create impactful dashboards, and start your career as a job-ready Power BI professional.