-
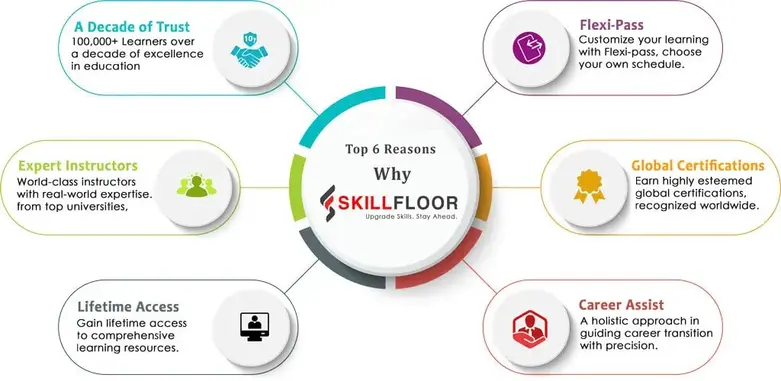
High Job Demand: Pondicherry’s expanding IT services, education sector, healthcare, tourism, and emerging startups are creating steady demand for skilled data analysts and business analysts.
-
Career Growth That Pays Off: Completing this program opens pathways to well-paying roles in data analytics and business intelligence, with organizations in and around Pondicherry actively seeking trained analytics professionals.
-
Industry-Aligned Curriculum: The course is designed in line with current industry standards, focusing on modern analytics tools, techniques, and real-world job requirements rather than outdated theory.
-
Expert-Led Sessions: Learn from experienced industry professionals who simplify complex concepts and share practical insights drawn from real analytics projects.
-
Hands-On Learning: Gain practical exposure through real business case studies and projects that help you apply analytics concepts confidently in workplace scenarios.
-
Master Essential Tools: Build strong proficiency in essential analytics tools such as Excel, Power BI, and Python, which are widely used across industries.
-
Dedicated Career Support: Skillfloor offers complete career assistance, including resume building, mock interviews, and placement guidance to help you secure suitable roles.
-
Recognized Certification: Earn a Skillfloor certification that enhances your professional credibility and improves your visibility in the Pondicherry and nearby job markets.
-
Strong Alumni Community: Become part of Skillfloor’s growing alumni network, enabling peer learning, mentorship, and access to new career opportunities.
- Affordable & High-Value Training: Skillfloor offers a practical, industry-oriented Data Analytics course at an affordable fee of just ₹14,900. This cost-effective program provides hands-on training, real-world projects, and expert guidance to ensure strong career returns on your investment.
How Business Analytics Is Powering India’s Digital Transformation
In India’s fast-paced digital economy, Business Analytics has become a key driver of growth and innovation. Companies across sectors such as IT, banking, healthcare, manufacturing, retail, and fintech increasingly rely on data to make smarter decisions and optimize performance. India accounts for nearly 17 percent of global demand for data analytics professionals, and the need for analytics and AI-driven insights continues to grow as organizations adopt automation, cloud platforms, and advanced technologies. This strong demand highlights how data-driven decision-making has become essential for business growth and digital transformation across the country.
To succeed in this changing environment, professionals need more than theoretical knowledge. Skillfloor’s Business Analytics training focuses on practical learning, real-world projects, and industry-aligned certification that match current hiring needs in India. Learners gain hands-on experience with Python, SQL, Power BI, data visualization, and analytical thinking, enabling them to solve real business problems with confidence. By combining technical skills with strategic understanding, Skillfloor prepares learners to contribute meaningfully to India’s digital transformation journey and build long-term, high-growth careers in analytics.
Objective of the Data Analytics Course at Skillfloor
The primary objective of Skillfloor’s Data Analytics course is to equip learners with practical, industry-ready skills that enable them to analyse, interpret, and derive actionable insights from data. The program is designed to bridge the gap between theoretical knowledge and real-world business applications, ensuring students and professionals can confidently handle analytics tasks across industries such as IT, finance, healthcare, e-commerce, and manufacturing.
Key objectives include:
-
Build Strong Analytical Foundations: Teach learners statistical concepts, data cleaning, and exploratory data analysis to handle structured and unstructured datasets effectively.
-
Master Key Tools and Technologies: Provide hands-on training in Excel, SQL, Python, R, Power BI, Tableau, and other industry-standard analytics tools.
-
Develop Business Problem-Solving Skills: Enable learners to apply analytics techniques to real-world business scenarios, creating dashboards, reports, and predictive models that guide decision-making.
-
Prepare for Industry Roles: Equip students with the skills needed for roles like Data Analyst, Business Analyst, BI Developer, Python Developer, and Analytics Consultant
-
Build a Strong Portfolio: Guide learners through live projects and case studies, creating a portfolio that demonstrates their capability to potential employers.
-
Certification and Career Readiness: Offer industry-recognised Skillfloor certifications that validate skills, boost employability, and improve chances of securing high-growth analytics roles.
Skillfloor’s Data Analytics course focuses not just on learning concepts but on applying them in real business contexts, ensuring learners are job-ready from day one.
Data Analytics Course Fee Structure in Pondicherry
-
Basic/Short-Term Courses (1–3 Months): ₹15,000–₹40,000
-
Advanced Certificate Courses (3–6 Months): ₹30,000–₹180,000
-
Post-Graduate/Diploma Programs (6–12 Months): ₹120,000–₹600,000
-
Executive/Master’s Programs (12–18 Months): ₹400,000–₹900,000
Skillfloor Course Fee Structure:
Skillfloor’s Data Analytics course fee in Pondicherry is competitively priced at ₹14,900, offering certified professional programs with hands-on projects, live training, internship opportunities, and dedicated career support—making it a cost-effective choice for students and working professionals.
-
Certified Data Analysis Professional: ₹14,900 (discounted from ₹60,000) — 2 months + 1-month internship.
-
Certified Business Analytics Professional: ₹14,900 (discounted from ₹60,000) — 2 months + 1-month internship.
-
Certified Power BI Analyst: ₹14,900 (discounted from ₹60,000) — 2 months + 1-month internship.
-
Certified Tableau Analyst: ₹14,900 (discounted from ₹60,000) — 2 months + 1-month internship.
Skillfloor Data Analytics Course Tools
Skillfloor’s Data Analytics courses equip learners with hands-on experience using industry-standard tools for analytics, machine learning, and visualisation.
-
Anaconda: Python distribution for managing libraries and running data science projects efficiently.
-
Advanced Excel: For data cleaning, analysis, and dashboards.
-
NumPy: Library for numerical computations and handling large datasets.
-
Pandas: A tool for data manipulation, cleaning, and structured data analysis.
-
Tableau: Create interactive and visually appealing dashboards.
-
Power BI: Business analytics and visualisation tool for actionable insights.
-
MongoDB: NoSQL database for managing unstructured and large datasets.
-
Hadoop: Framework for distributed storage and big data processing.
-
Apache PySpark: Big data analytics with Python on distributed systems.
-
TensorFlow: Open-source library for building machine learning and AI models.
Career Roles You Can Grow Into With Business Analytics
Business Analytics equips you with the ability to turn data into decisions that drive real business impact. As organizations increasingly rely on data, professionals with analytics skills are moving into roles that influence strategy, performance, and growth across industries.
-
Business Analyst: Business Analysts are the bridge between data and decision-making. They gather, interpret, and analyze data to identify trends, inefficiencies, and opportunities for business improvement. Their insights help organizations make smarter operational and strategic choices. Companies rely on Business Analysts and AI Professionals to convert raw data into actionable recommendations that drive growth and efficiency.
-
Power BI Analyst: Power BI Analysts specialize in transforming complex datasets into clear, interactive dashboards and reports. By using tools like Power BI, they provide real-time insights to stakeholders, enabling faster and more informed decision-making. Their work is crucial for monitoring key performance indicators (KPIs), tracking trends, and presenting data visually to both technical and non-technical audiences.
-
Analytics Consultant: Analytics Consultants work across teams, departments, or clients to solve complex business challenges using data-driven strategies and data engineering solutions. They provide insights that optimize processes, improve ROI, and guide strategic decisions. This role requires a strong understanding of business operations, analytics tools, and data engineering workflows, along with the ability to translate analytical findings into actionable solutions.
-
Customer Insights Analyst: Customer Insights Analysts focus on understanding consumer behavior, preferences, and trends. They leverage data from multiple sources such as CRM systems, web analytics, and social media to help businesses personalize experiences, enhance customer engagement, and improve marketing strategies. Their insights directly influence product development, customer retention, and revenue growth.
-
Data Visualization Specialist: Data Visualization Specialists, also known as Tableau Analysts, turn complex data into visual stories that are easy to understand and act upon. Using tools like Tableau and Power BI, they design charts, dashboards, and reports that highlight key trends and metrics. Their work enables stakeholders to quickly grasp insights, communicate findings effectively, and make informed business decisions.
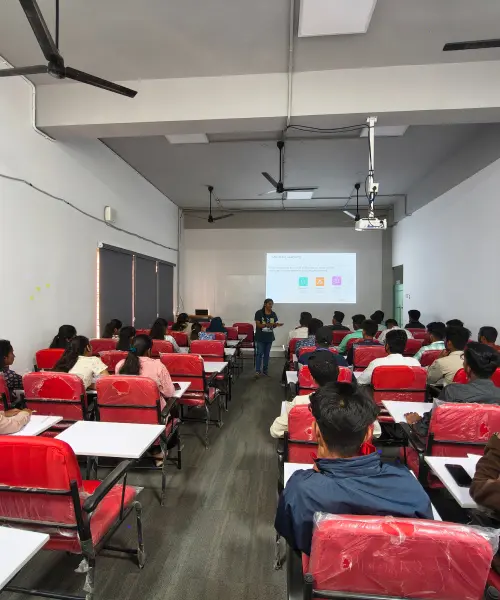
Hands-On Internships and Projects at Skillfloor
At Skillfloor, we believe learning by doing is the key to career readiness. Our Data Analytics and Business Analytics programs are designed to give you practical exposure through live projects and internships, so you graduate with real-world skills that employers value.
Real-World Projects:
-
Business Dashboards and Reports: Build interactive dashboards using Power BI and Tableau to visualize key business metrics.
-
Predictive Analytics Use Cases: Apply machine learning algorithms to forecast trends and make data-driven decisions.
-
Data Cleaning and Exploration: Work with raw datasets to identify patterns, fix inconsistencies, and generate actionable insights.
-
End-to-End Analytics Projects: Solve real business problems from data collection to analysis and insight presentation, creating a strong portfolio to showcase to recruiters.
Internship Opportunities:
-
Live Industry Internships: Collaborate with companies on ongoing analytics projects to gain hands-on industry experience.
-
Mentor-Led Guidance: Learn directly from industry experts who provide feedback, review your work, and share insights on best practices.
-
Career-Ready Experience: Internships help you understand workplace dynamics, improve problem-solving skills, and build confidence for full-time roles.
Transform Your Future with Data Analytics at Skillfloor
Data analytics is transforming how modern organizations operate, innovate, and make strategic decisions, establishing itself as one of the fastest-growing and most secure career paths today. At Skillfloor Pondicherry, we provide industry-aligned training, expert mentorship, and dedicated support to help learners build strong and rewarding careers in the analytics domain. As one of the leading analytics training providers in Pondicherry, Skillfloor ensures that every student gains the knowledge and confidence needed to excel in data-driven roles.
Our Data Analytics courses in Pondicherry are designed to equip you with the latest tools, techniques, and industry best practices, keeping you competitive and future-ready. Skillfloor offers specialized programs in Data Science, Data Analytics, Artificial Intelligence, Machine Learning, Data Engineering, and Python Programming, catering to learners at all levels, from beginners to working professionals. If you’re exploring advanced career opportunities in AI, you can also check out our Artificial Intelligence Course in Pondicherry to gain specialized skills and unlock high-demand roles. For those looking to expand their skill set beyond analytics, Skillfloor also provides a comprehensive Digital Marketing Course in Pondicherry, covering SEO, social media marketing, Google Ads, content strategy, and analytics-based marketing with hands-on training and placement support.