-
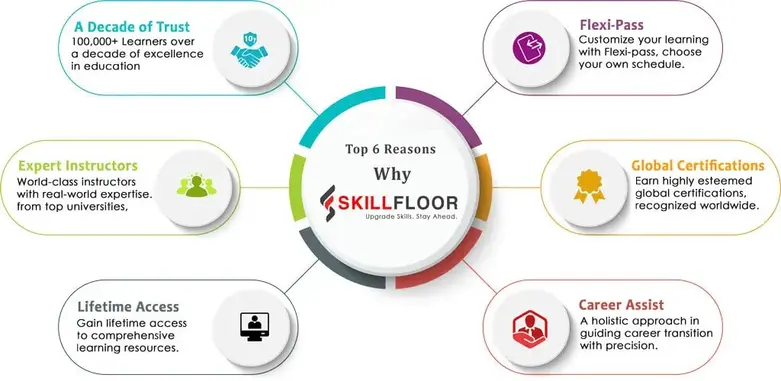
High Job Demand: As companies in Guwahati and Northeast India adopt data-driven practices, the need for skilled data and business analysts is rapidly increasing across sectors like IT, finance, logistics, and e-commerce.
-
Rewarding Career Path: Build a future-proof career with excellent compensation, recognition, and long-term stability in analytics roles.
-
Industry-Aligned Curriculum: The curriculum is designed with expert inputs to match the latest analytics tools, techniques, and real-world business requirements.
-
Expert-Led Sessions: Learn directly from industry professionals who simplify technical concepts and share valuable practical insights during every session.
-
Hands-On Learning: Gain real-world experience through case studies, live datasets, dashboards, and predictive models, ensuring strong job-ready skills.
-
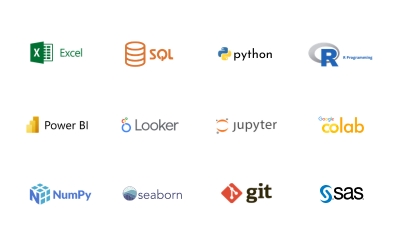
Master Essential Tools: Build proficiency in Excel, SQL, Python, Power BI, and Tableau, the core tools required for a successful analytics career.
-
Dedicated Career Support: Skillfloor provides complete placement assistance, including resume building, mock interviews, interview prep, and job referrals across Guwahati and Assam.
-
Recognized Certification: Earn a Skillfloor certification that boosts your resume and credibility while enhancing your chances of getting hired.
-
Strong Alumni Community: Join an active Skillfloor community that supports continuous learning, mentoring, and networking for future career opportunities.
-
Exceptional Value: With affordable pricing and high-quality training, the Guwahati analytics program offers outstanding value and sets you on the path to a successful analytics career.
Rise of AI-Powered Analytics Careers
The demand for professionals in AI-powered analytics is accelerating as businesses shift toward automation and data-driven intelligence. Companies now use machine learning, predictive analytics, and AI-based forecasting models to improve efficiency and drive innovation. This growth is strongly supported by industry statistics, recent census workforce trends, and nationwide digital transformation initiatives.
According to emerging talent census reports, roles in data analytics, AI engineering, and business intelligence are among the fastest-growing job categories in India, with Coimbatore leading in tech-driven hiring. As organizations increasingly depend on AI-driven insights for decision-making, the need for professionals skilled in advanced analytics, neural networks, data modelling, and automation tools continues to rise, making AI-powered analytics one of the most promising and future-proof career paths today.
Average Data Analyst Salaries Across Key Global Markets
Data analytics professionals are in high demand worldwide, with competitive salaries reflecting their expertise. As of 2025, the average annual salaries for Data Analysts taken from Glassdoor are as follows:
- India: The average salary for a Data Analyst in India is ₹5 LPA to ₹10.5 LPA.
- United States: The salary of Data Analysts in the United States on an average is $55T to $86T annually.
- United Kingdom: The average salary of a Data Analyst in the UK is £28T - £43T annually.
- United Arab Emirates: The Data Analysts salary in Dubai on an average is AED 7T - AED 17T monthly.
These figures highlight the growing recognition of data analytics as a pivotal field across various industries, offering lucrative career opportunities globally.
How Analytics Is Driving the Next Tech Wave
Guwahati is witnessing a significant digital transformation, with businesses and government departments increasingly adopting data analytics to modernize operations. Studies show that over 65% of companies in Northeast India are now leveraging analytics for decision-making, up from just 40% five years ago. From telecom operators monitoring network performance to retail chains analyzing purchasing patterns, analytics helps organizations reduce operational inefficiencies by 20–30% and make faster, data-backed decisions.
Assam’s growing startup ecosystem, combined with rapid tech adoption in sectors like education, tourism, healthcare, and logistics, has accelerated the demand for real-time data insights. Companies in Guwahati now rely on dashboards, automated reporting, and predictive forecasting models to manage growth, optimize day-to-day operations, and understand customer behavior. With the regional analytics job market projected to grow by 18–20% annually, this shift toward data-driven functioning has created a strong demand for trained analytics professionals, making Guwahati an emerging hub for career opportunities in data science, business intelligence, and machine learning.
Business Analytics Trends Shaping Industries in Guwahati
Industries in Guwahati are rapidly adopting business analytics to stay competitive. Over 60% of banks and financial institutions in Northeast India now use analytics for credit risk evaluation and customer segmentation, while manufacturing units leverage data to improve efficiency by 15–25% and enhance quality control. E-commerce and logistics providers rely on demand forecasting, route optimization, and warehouse analytics, reducing operational costs by up to 20%.
Education and healthcare sectors in the city are also implementing analytics for student performance tracking, patient management, and operational planning, achieving 10–15% process improvements. With analytics roles in Guwahati projected to grow by 18–20% annually, skilled professionals capable of designing dashboards, interpreting data, and supporting strategic decisions are increasingly in demand, positioning the city as a rising hub for data-driven careers in Northeast India.
Data Analytics Course Fee Structure in Guwahati
-
Basic/Short-Term Courses (1–3 Months): ₹15,000–₹40,000
-
Advanced Certificate Courses (3–6 Months): ₹30,000–₹180,000
-
Post-Graduate/Diploma Programs (6–12 Months): ₹120,000–₹600,000
-
Executive/Master’s Programs (12–18 Months): ₹400,000–₹900,000
Skillfloor Course Fee Structure:
Skillfloor’s Data Analytics course fee in Guwahati is competitively priced at ₹14,900, offering certified professional programs with hands-on projects, live training, internship opportunities, and dedicated career support—making it a cost-effective choice for students and working professionals.
-
Certified Data Analysis Professional: ₹14,900 (discounted from ₹60,000) — 2 months + 1-month internship.
-
Certified Business Analytics Professional: ₹14,900 (discounted from ₹60,000) — 2 months + 1-month internship.
-
Certified Power BI Analyst: ₹14,900 (discounted from ₹60,000) — 2 months + 1-month internship.
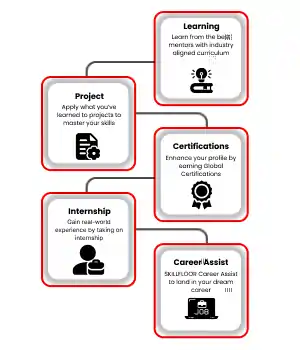
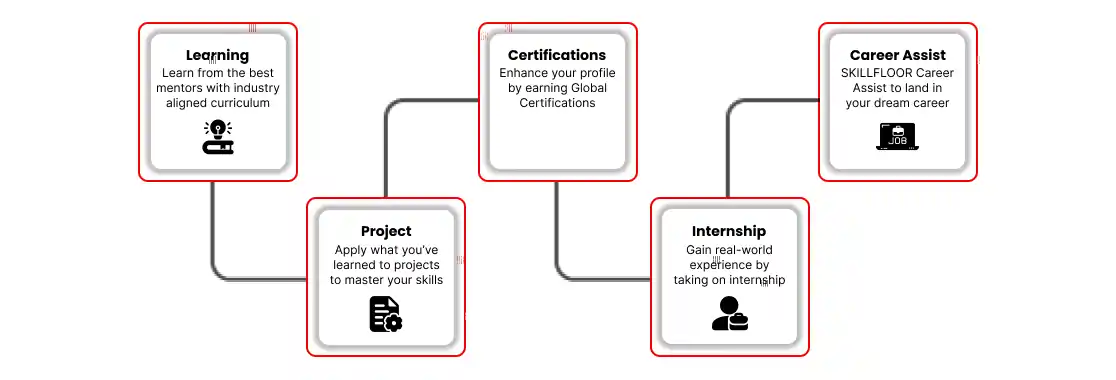
Three-Phase Learning Methodology for Data Analytics at Skillfloor
Skillfloor follows a structured and outcome-driven Three-Phase Learning Methodology designed to equip learners with strong analytical expertise, practical experience, and complete job readiness. This approach ensures every student whether a fresher or a working professional develops the skills needed to excel in today’s competitive analytics job market.
Phase 1 – Foundational Preparation
Learners begin with guided self-paced study materials, including video lessons, eBooks, practice exercises, and foundational modules. This phase builds core knowledge in statistics, Excel, SQL, Python, data visualization, and business understanding, helping students enter the live training with confidence.
Phase 2 – Expert-Led Training & Hands-On Projects
In this phase, students participate in live instructor-led sessions, tool-based training, and real-time practice with datasets. Skillfloor’s industry experts deliver practical insights using tools such as Excel, Power BI, Tableau, Python, and MySQL. Learners also work on capstone projects, business case studies, and tool-based assignments that simulate real industry challenges.
Phase 3 – Internship & Real-World Project Experience
Skillfloor provides students with internship opportunities, live business projects, and guided industry workflows to ensure practical exposure. During this phase, learners apply their knowledge to real datasets, build dashboards, perform exploratory data analysis, and create predictive models. They also receive resume building, mock interview coaching, portfolio development, and placement assistance, ensuring they are completely job-ready.
Skillfloor’s Three-Phase Learning Model bridges theoretical understanding with applied industry experience, empowering learners to confidently begin careers in Data Analytics, Business Analytics, and Business Intelligence.
Begin Your Data Analytics Journey with Skillfloor
Data analytics is transforming how organizations operate, make decisions, and innovate, making it one of the most future-proof career paths today. At Skillfloor, we provide industry-aligned training, expert guidance, and continuous support to help students in Guwahati build strong and successful careers in the analytics field. As a leading analytics institute, we equip learners with the essential skills needed to excel in data-driven roles.
Our Data Analytics training programs equip you with the latest tools, techniques, and industry best practices, ensuring you remain competitive and future-ready. Skillfloor offers specialized courses in Data Science, Data Analytics, Artificial Intelligence, Machine Learning, Data Engineering, and Python Programming for all skill levels.. If you're exploring opportunities beyond Guwahati, you can also check our Analytics Course in Guwahati, to advance your career in another growing tech hub. Suppose you're looking to expand your skill set beyond analytics. In that case, Skillfloor also offers a comprehensive Digital Marketing Course in Guwahati, where you can learn SEO, social media marketing, Google Ads, content strategy, and email marketing with hands-on projects and placement support.