- High Job Demand: Faridabad is a fast-growing business and industrial hub within the Delhi NCR region, with strong hiring demand across manufacturing, IT services, BFSI, logistics, consulting, retail, and corporate enterprises for skilled data and business analysts to support data-driven decision-making.
-
Future-Proof Career Opportunities: Build a future-ready career with attractive compensation, faster growth, and long-term stability in analytics and business intelligence roles across Faridabad and the wider NCR job market.
-
Industry-Aligned Curriculum: The course is designed with expert input to match Faridabad’s evolving job market, covering modern analytics tools, business applications, and real-world workflows relevant to NCR-based organizations.
-
Expert-Led Sessions: Learn from experienced industry professionals who share practical insights, simplify complex concepts, and guide learners through real business challenges.
-
Hands-On Learning: Gain practical exposure through case studies, live datasets, dashboards, and end-to-end analytics projects that develop strong job-ready skills.
-
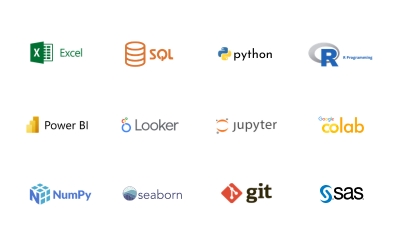
Master Essential Tools: Develop proficiency in Excel, SQL, Python, Power BI, and Tableau—tools widely used across Faridabad, Delhi, Gurgaon, Noida, and the broader NCR analytics ecosystem.
-
Dedicated Career Support: Skillfloor provides complete placement support, including resume building, mock interviews, personalized interview preparation, and job referrals across Faridabad and the Delhi NCR region.
-
Recognized Certification: Earn an industry-recognized Skillfloor certification that strengthens your profile and improves your chances of securing top analytics roles.
-
Strong Alumni Community: Become part of Skillfloor’s growing alumni network in Faridabad and NCR, enabling peer learning, professional networking, and long-term career support.
-
Exceptional Value: Skillfloor offers a practical, industry-oriented Data Analytics course at an affordable fee of just ₹14,900. This cost-effective program provides hands-on training, real-world projects, and expert guidance to ensure strong career returns on your investment.
How Business Analytics Is Driving Digital Growth Across India
Business Analytics is playing a powerful role in accelerating digital growth across India, helping organizations turn data into smarter decisions and measurable outcomes. India currently leads the global market in demand for analytics and data science professionals, accounting for nearly 17 percent of worldwide analytics job openings. The Indian data analytics market, valued at approximately USD 2.6 billion, is projected to grow at a strong compound annual growth rate of over 25 percent, driven by rapid digital transformation, cloud adoption, and increasing use of AI-driven insights. Businesses across IT services, banking, retail, healthcare, manufacturing, and e-commerce are leveraging business analytics to improve customer experience, optimize operations, and gain a competitive advantage in an increasingly data-driven economy.
The adoption of business intelligence tools, predictive analytics, and real-time data dashboards is reshaping how Indian companies plan and execute their strategies. Studies show that over 60 percent of Indian enterprises now consider data-driven decision-making a critical pillar of their digital growth initiatives, while nearly 80 percent plan to expand investments in AI and machine learning over the next few years. From supply chain optimization to personalized marketing and financial forecasting, analytics-powered insights are enabling faster decisions, reduced risks, and improved business performance. As organizations continue to rely on data science, analytics, and AI, business analytics is no longer a support function—it has become a core driver of India’s digital economy and long-term business innovation.
Salary Trends in Business Analytics Across India
India’s rapid digital transformation and growing reliance on data-driven decision-making have significantly boosted the demand and salaries for business analytics professionals. Companies across IT, BFSI, healthcare, retail, manufacturing, and consulting are hiring skilled analysts who can turn raw data into actionable insights.
Business Analytics Compensation at a Glance in India :
-
Business Analytics Freshers: Earn 3 to 6 LPA, depending on project exposure; tool proficiency, such as Excel, SQL, and Power BI, and certification strength.
-
Business Analysts (1 to 3 years): Typically earn 6 to 10 LPA as they start handling reporting, data modelling, and business insights.
-
Senior Business Analysts: Earn 10 to 18 LPA for managing strategy-driven analytics, stakeholder communication, and complex dashboards.
-
Data Analysts: Earn 4 to 9 LPA as demand grows across finance, e-commerce, and consulting.
-
BI Analysts or BI Developers: Earn 5 to 12 LPA due to increased adoption of Power BI, Tableau, and automated reporting.
-
AI and Advanced Analytics Professionals: Earn 8 to 20 LPA or more, especially those skilled in predictive analytics, automation, and machine learning.
The talent gap remains high across India, and employers are willing to offer strong packages to candidates who are job-ready with hands-on project experience. Skillfloor’s practical, certification-led training helps learners stand out and secure competitive roles in top companies.
In-Demand Data Analytics Roles and Skillsets Needed Today
As Faridabad continues to strengthen its position as an emerging hub for manufacturing, IT services, consulting, and data-driven business operations, the demand for skilled data analytics professionals is steadily increasing across industries. Organizations are actively seeking talent that can analyze data, improve efficiency, and support strategic decision-making. Some of the most in-demand analytics roles include:
-
Data Analyst: Collects, cleans, and analyzes data to generate actionable insights that support business and operational decisions.
-
Business Analyst: Bridges the gap between data and business needs by identifying trends, improving processes, and recommending growth-focused solutions.
-
BI Analyst (Business Intelligence Analyst): Develops dashboards, reports, and visualizations to help leadership teams track performance and make informed decisions.
-
Reporting Analyst: Prepares regular MIS reports, KPIs, and performance summaries to monitor business health and operational outcomes.
-
Analytics Consultant: Guides organizations in adopting data-driven strategies, optimizing processes, and implementing analytics solutions. Professionals can also explore roles as a Generative AI Specialist, developing AI-driven models to generate insights, automate processes, and create intelligent solutions.
To succeed in these analytics and AI roles, professionals should focus on building the following core skillsets:
-
Programming and Analytics Tools: Strong proficiency in Excel, SQL, Python, Power BI, and Tableau.
-
Data Analysis and Visualization: Ability to interpret large datasets and present insights clearly through dashboards and reports.
-
Statistics and Mathematics: Solid understanding of statistical concepts, probability, and data modeling techniques.
-
Big Data and Cloud Technologies: Familiarity with platforms such as Hadoop, PySpark, and cloud-based analytics tools.
-
Soft Skills: Critical thinking, problem-solving, and strong communication skills to translate data insights into actionable business decisions.
With businesses in Faridabad increasingly adopting analytics, AI, and data-driven decision-making, professionals who build these skills can unlock strong career growth and long-term opportunities across multiple industries.
Master the Art of Converting Data Into Practical Insights
Skillfloor’s Data Analytics course modules are designed to equip learners with practical, industry-ready skills for today’s data-driven world. Each module combines hands-on training with real-world applications, helping students turn data into actionable insights. With a structured curriculum, learners gain the expertise needed to excel in analytics roles and drive smarter business decisions.
- Foundations of Business Analytics and Data Thinking
This module builds a strong analytics mindset. Learners understand how businesses use data and data analysis to make smarter decisions, identify opportunities, and reduce risks. Core concepts like data types, business metrics, KPIs, and problem framing are introduced in a simple, practical way.
- Data Analysis Using Excel, SQL, and Python
Learners gain hands-on experience with the most widely used analytics tools. This module focuses on data cleaning, data manipulation, and analysis using Excel, SQL, and Python, helping learners work confidently with real business datasets and extract meaningful insights.
- Data Visualization and Business Intelligence
This module teaches learners how to convert insights into clear stories. Using Power BI and Tableau, students build interactive dashboards and reports that help decision-makers quickly understand trends, performance, and opportunities across departments.
- Statistics and Predictive Analytics for Business
Learners explore statistical concepts and predictive techniques used in real business scenarios. The focus is on understanding patterns, forecasting outcomes, and supporting strategic decisions using data-backed reasoning rather than assumptions.
- Real-World Projects, Case Studies, and Certification
The final module emphasizes practical application. Learners work on industry-relevant projects and case studies, simulating real business challenges. With mentor guidance and project-based learning, students graduate with a strong portfolio and an industry-recognized Skillfloor certification that enhances employability.
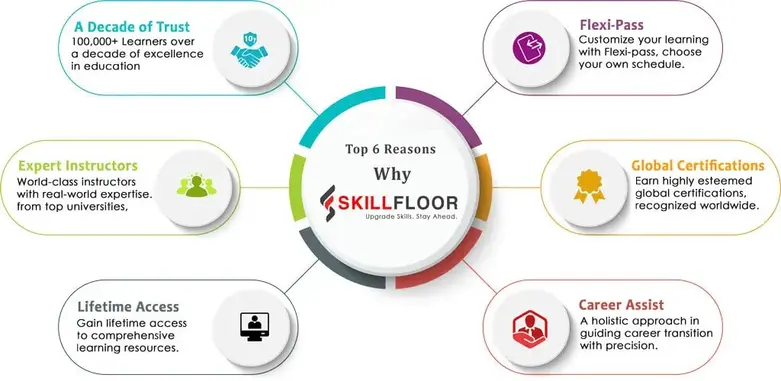
Why Choose Skillfloor for Data Analytics Training
Skillfloor offers industry-focused data analytics training designed to equip learners with practical skills and recognized certifications to excel in today’s data-driven world.
-
Expert-Led Training: Learn from experienced industry professionals who provide hands-on guidance and share real-world insights, ensuring learners gain both technical skills and business understanding.
-
Comprehensive Curriculum: The course covers essential topics from data handling and statistical analysis to Python, SQL, Tableau, Power BI, and advanced analytics techniques, making it suitable for beginners and professionals alike.
-
Hands-On Projects: Gain practical experience through real-world projects and case studies, applying analytical techniques to solve business problems and build a strong portfolio.
-
Flexible Learning Options: Choose from online live classes, self-paced e-learning, or offline classroom sessions to match your schedule and learning style.
-
Career Support and Certification: Receive an industry-recognized Skillfloor certification, along with guidance on resume building, interview preparation, and placement support to boost career growth in data analytics.
Data Analytics Course Fee Structure in Faridabad
-
Basic/Short-Term Courses (1–3 Months): ₹15,000–₹40,000
-
Advanced Certificate Courses (3–6 Months): ₹30,000–₹180,000
-
Post-Graduate/Diploma Programs (6–12 Months): ₹120,000–₹600,000
-
Executive/Master’s Programs (12–18 Months): ₹400,000–₹900,000
Skillfloor Course Fee Structure:
Skillfloor’s Data Analytics course fee in Faridabad is competitively priced at ₹14,900, offering certified professional programs with hands-on projects, live training, internship opportunities, and dedicated career support—making it a cost-effective choice for students and working professionals.
-
Certified Data Analysis Professional: ₹14,900 (discounted from ₹60,000) — 2 months + 1-month internship.
-
Certified Business Analytics Professional: ₹14,900 (discounted from ₹60,000) — 2 months + 1-month internship.
-
Certified Power BI Analyst: ₹14,900 (discounted from ₹60,000) — 2 months + 1-month internship.
-
Certified Tableau Analyst: ₹14,900 (discounted from ₹60,000) — 2 months + 1-month internship.
Start Your Data Analytics Journey in Faridabad Today
Faridabad, a rapidly growing industrial and commercial hub in Haryana, is emerging as a key center for education, business, and technology. With its expanding industrial ecosystem and focus on digital transformation, the city offers an excellent environment for learning and career development. Faridabad’s modern infrastructure and forward-thinking approach make it an ideal destination for individuals seeking a top Data Analytics Institute in Faridabad and promising career opportunities. The city’s growing adoption of technology and innovation creates the perfect environment for aspiring data analytics professionals to thrive.
Our Data Analytics courses in Faridabad are designed to equip learners with the latest tools, techniques, and industry-relevant practices, ensuring they remain competitive and future-ready. Skillfloor offers specialized programs in Data Science, Data Analytics, Artificial Intelligence, Machine Learning, Data Engineering, and Python Programming, catering to beginners, students, and working professionals. For those interested in advanced roles in AI, Skillfloor’s Artificial Intelligence Course in Faridabad provides in-demand skills for high-growth opportunities. Additionally, professionals looking to expand their expertise can explore Skillfloor’s Digital Marketing Course in Faridabad, covering SEO, social media marketing, Google Ads, content strategy, and analytics-driven marketing with hands-on training and placement support.