-
Growing Analytics Career Opportunities: Ghaziabad’s expanding IT services, digital businesses, startups, and enterprise operations are creating steady demand for data analysts and business intelligence professionals, offering long-term career growth and stability.
-
High-Paying Job Prospects: Skillfloor’s industry-ready analytics training in Ghaziabad prepares learners for well-paying roles in data analytics, business analytics, BI development, and reporting across multiple industries.
-
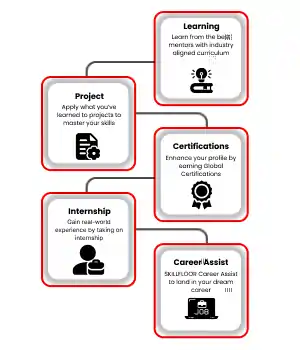
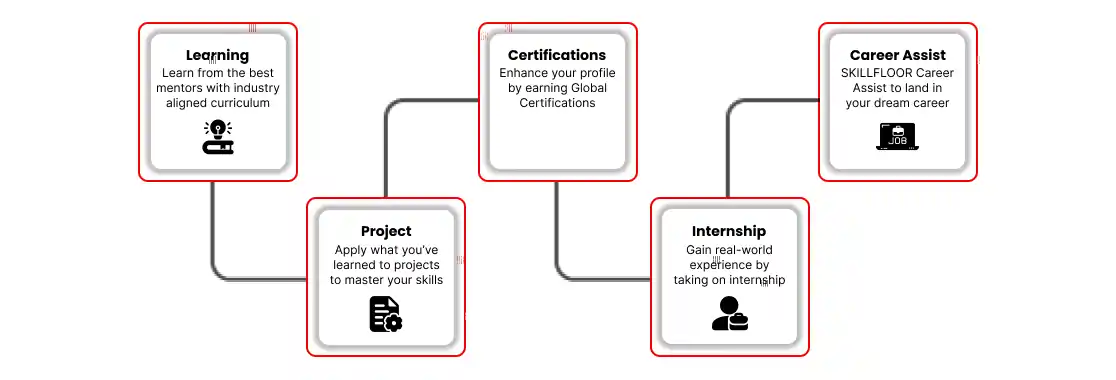
Expert-Curated Curriculum: The program follows an industry-aligned syllabus designed around current market needs, covering essential analytics tools, real-world case studies, and practical workflows.
-
Training by Industry Specialists: Learn from experienced analytics and BI professionals who bring real-world insights, hands-on expertise, and industry best practices into every training session.
-
Practical, Real-World Exposure: Gain hands-on experience with live datasets, business case studies, and project-based learning that help you confidently solve real business challenges.
-
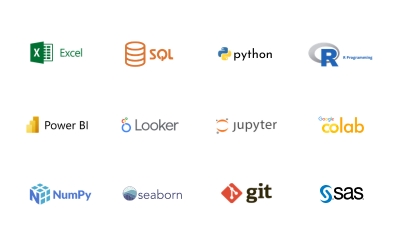
Proficiency in Key Analytics Tools: Master in-demand tools such as Excel, SQL, Python, Power BI, and Tableau, giving you a competitive edge in Ghaziabad’s growing analytics job market.
-
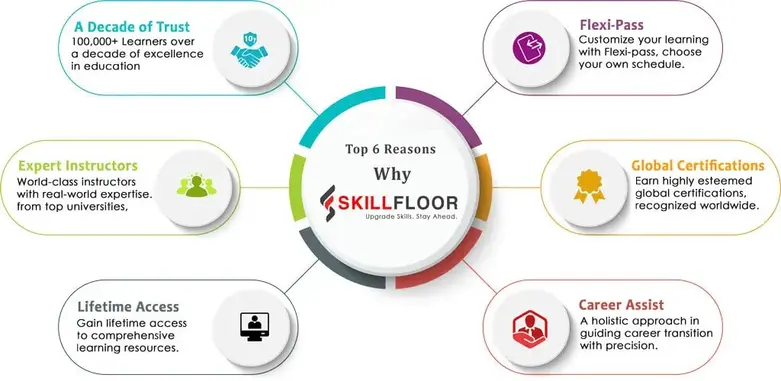
Comprehensive Career Support: Receive end-to-end career assistance, including resume building, mock interviews, career guidance, and placement support for analytics roles in Ghaziabad and other major cities.
-
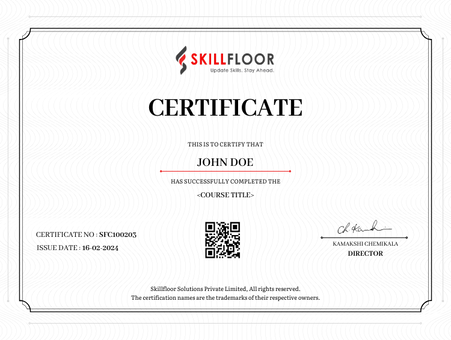
Industry-Recognized Certification: Earn a Skillfloor Analytics Certification that enhances professional credibility and strengthens your profile with recruiters and employers.
-
Supportive Learning Community: Become part of Skillfloor’s active learner and alumni network, enabling mentorship, peer collaboration, and job referral opportunities.
-
Affordable and High-Value Training: Skillfloor offers a practical, industry-oriented Data Analytics course at an affordable fee of just ₹14,900. This cost-effective program provides hands-on training, real-world projects, and expert guidance to ensure strong career returns on your investment.
Business Analytics Careers in a Competitive Job Market
As competition intensifies across industries, organizations are placing greater emphasis on business analytics to drive smarter decision-making. Companies increasingly depend on data to improve strategy, operations, and customer experiences. Industry research shows that the global business analytics market is growing at a double-digit CAGR, with demand for analytics professionals expected to rise by over 30 percent in the coming years. In India, more than 20 percent of job postings across technology, finance, and consulting now require analytics or data-driven skills, reflecting how central analytics has become in a competitive job market. Sectors such as IT services, healthcare, retail, and banking continue to expand their analytics teams to stay efficient and competitive.
For professionals, this demand brings clear opportunities but also higher expectations. Employers look beyond basic certifications and prioritize candidates who can apply analytics tools to real business problems. Skills in data visualization, SQL, Python, Power BI, and predictive analysis consistently appear in top analytics job requirements. With many organizations facing a shortage of job-ready analytics talent, professionals who combine hands-on analytical skills with strong business understanding are well-positioned for career growth, better salaries, and long-term stability in today’s competitive job market.
AI and Business Analytics Job Market Trends
Ghaziabad’s job market for data science and artificial intelligence is growing steadily, driven by its proximity to Delhi NCR, expanding IT services, manufacturing units, and a strong corporate presence. Companies across industries are increasingly hiring professionals who can analyze data, build AI-driven solutions, and support data-backed business decisions.
Key trends shaping the job market:
-
Rising demand for analytics professionals: Industry estimates show a 25–30% increase in hiring for data science and AI roles in the Ghaziabad–NCR region over the past two years. Organizations are actively recruiting talent for predictive analytics, machine learning, and automation initiatives.
-
Growth of hybrid roles: Employers prefer professionals who combine technical expertise with business or domain knowledge. Roles such as AI Analyst, Data Scientist with domain specialization, and Business Analytics Professional are becoming more common.
-
Focus on AI-powered business solutions: AI is increasingly used for supply chain optimization, customer insights, fraud detection, demand forecasting, and process automation. This has increased demand for Machine Learning Engineers, NLP specialists, and AI developers.
-
Competitive salary trends: Entry-level data science and analytics roles typically start at ₹4–6 LPA, mid-level professionals earn around ₹8–14 LPA, while senior AI roles can go beyond ₹18–20 LPA, depending on skills and experience.
-
Startup and enterprise adoption: Ghaziabad’s growing startup ecosystem and NCR-based enterprises are investing heavily in AI and analytics, creating opportunities in fintech, logistics, healthcare, manufacturing, and SaaS.
-
Remote and hybrid work opportunities: Many organizations now offer remote and hybrid roles, allowing Ghaziabad-based professionals to work with national and global clients while gaining international exposure.
-
Skill-based hiring over degrees: Employers increasingly value hands-on experience, project work, and certifications. Candidates with practical training and certifications, such as AI and Data Science programs, are often preferred.
Ghaziabad’s AI and data science job market is expanding rapidly, offering strong career opportunities for professionals who can convert analytical insights into real business impact. With growing demand, competitive salaries, and diverse industry applications, Ghaziabad is emerging as a promising destination for high-growth analytics and AI careers.
Business Analytics Course Duration at Skillfloor
The Business Analytics course at Skillfloor is thoughtfully structured to help learners build strong analytical and business decision-making skills within a practical and job-oriented timeframe. The course duration is carefully designed to balance conceptual learning with hands-on practice, ensuring students gain both theoretical knowledge and real-world exposure. Whether you are a fresher, a working professional, or someone transitioning into analytics, Skillfloor’s flexible learning approach allows you to progress at a comfortable yet effective pace.
Typically, the Business Analytics course duration at Skillfloor ranges from 3 to 6 months, depending on the learning mode and batch schedule. This duration includes instructor-led training, hands-on tool sessions, live projects, and real business case studies. The program starts with analytics fundamentals and gradually advances to topics such as business intelligence, predictive analysis, and data-driven strategy building, ensuring a well-structured learning journey. The course is offered at an affordable fee of ₹14,900, making it a cost-effective option for learners seeking industry-relevant analytics training with strong career value.
What the Course Duration Includes:
-
Foundational Training: Core business analytics concepts, data interpretation, and statistical fundamentals.
-
Tool-Based Learning: Practical training on industry-relevant tools such as Excel, SQL, Power BI, Tableau, and Python.
-
Practical Assignments: Regular exercises and real-world business case studies to apply analytical concepts.
-
Live Projects: Hands-on projects that simulate real business scenarios and build job-ready experience.
-
Assessments & Reviews: Periodic evaluations to monitor progress and strengthen analytical thinking.
In addition to technical training, Skillfloor integrates career-focused support throughout the course duration. Learners receive resume-building assistance, interview preparation, and career guidance alongside their technical learning, ensuring they are job-ready upon completion. With its structured duration, practical learning approach, and affordable course fee of ₹14,900, Skillfloor’s Business Analytics course, which includes Python training, prepares learners to confidently pursue roles such as Python Developer, Business Analyst, Data Analyst, BI Analyst, or Reporting Analyst across multiple industries.
Data Analytics Course Fee Structure in Ghaziabad
-
Basic/Short-Term Courses (1–3 Months): ₹15,000–₹40,000
-
Advanced Certificate Courses (3–6 Months): ₹30,000–₹180,000
-
Post-Graduate/Diploma Programs (6–12 Months): ₹120,000–₹600,000
-
Executive/Master’s Programs (12–18 Months): ₹400,000–₹900,000
Skillfloor Course Fee Structure:
Skillfloor’s Data Analytics course fee in Ghaziabad is competitively priced at ₹14,900, offering certified professional programs with hands-on projects, live training, internship opportunities, and dedicated career support—making it a cost-effective choice for students and working professionals.
-
Certified Data Analysis Professional: ₹14,900 (discounted from ₹60,000) — 2 months + 1-month internship.
-
Certified Business Analytics Professional: ₹14,900 (discounted from ₹60,000) — 2 months + 1-month internship.
-
Certified Power BI Analyst: ₹14,900 (discounted from ₹60,000) — 2 months + 1-month internship.
-
Certified Tableau Analyst: ₹14,900 (discounted from ₹60,000) — 2 months + 1-month internship.
Top Analytics Tools and Technologies You Will Master
Skillfloor’s analytics programs cover essential tools and technologies that companies use every day. The training is practical and designed to help beginners and professionals build strong analytical skills.
-
Excel and Advanced Excel - Learn data cleaning, formulas, dashboards, pivot tables, and automation techniques that form the foundation of analytics.
-
SQL for Data Analysis - Develop skills in writing queries, filtering data, joining tables, and managing databases used in every analytics role.
-
Power BI - Create business intelligence dashboards, learn data modeling, use DAX functions, and build reports for real-time insights.
-
Tableau - Design dashboards, visualize complex datasets, and use visual storytelling to communicate insights effectively.
-
Python for Analytics - Work with data manipulation, visualization, and introductory machine learning through libraries such as Pandas, NumPy, and Matplotlib.
-
Statistics and Business Analytics - Understand core statistical concepts, forecasting methods, hypothesis testing, and business metrics used for decision-making.
Internships and Placement Support
Skillfloor in Ghaziabad places a strong emphasis on practical, hands-on learning as part of its analytics courses. The programs include integrated internship opportunities, allowing learners to work on live, industry-relevant projects aligned with current business needs in the NCR region. This real-world exposure helps students:
-
Strengthen technical and analytical skills
-
Improve problem-solving and data-driven decision-making abilities
-
Build professional confidence by working on real business scenarios
These internship experiences ensure learners are well-prepared to meet the expectations of professional analytics roles across industries.
Skillfloor also offers dedicated placement support for its analytics courses in Ghaziabad, providing learners with end-to-end career guidance. The Placement Assistance Team supports students with:
-
Resume building to effectively highlight analytics skills and project experience
-
Mock interviews to enhance technical understanding and communication skills
-
Interview preparation tailored for analytics roles across multiple industries
-
Networking opportunities with hiring partners to improve job prospects
Learners who complete the program are prepared for roles such as Data Analyst, Business Analyst, BI Analyst, Reporting Analyst, and Data Analytics Professional. Through a combination of hands-on internships and structured career support, Skillfloor ensures students are job-ready and well-positioned to succeed in Ghaziabad’s growing analytics and business intelligence job market.
Start Your Data Analytics Journey in Ghaziabad Today
Ghaziabad, located in Uttar Pradesh and part of the Delhi NCR region, is steadily developing as a center for technology, business, and professional growth. With its expanding industrial and corporate ecosystem, Ghaziabad offers a perfect blend of opportunity and accessibility, making it an ideal destination for individuals seeking a Data Analytics Institute in Ghaziabad and promising career prospects. The city’s growing IT infrastructure and progressive approach encourage innovation and create a supportive environment for data analytics and AI enthusiasts to excel.
Our Data Analytics courses in Ghaziabad are designed to provide learners with the latest tools, techniques, and industry-relevant practices, keeping them competitive and future-ready. Skillfloor offers specialized programs in Data Science, Data Analytics, Artificial Intelligence, Machine Learning, Data Engineering, and Python Programming, catering to beginners as well as working professionals. For those aiming for advanced AI roles, the Artificial Intelligence Course in Ghaziabad equips learners with in-demand skills to access high-growth career opportunities. Additionally, Skillfloor’s Digital Marketing Course in Ghaziabad empowers learners with hands-on expertise in SEO, social media marketing, Google Ads, content strategy, and analytics-driven marketing, along with placement support to help secure industry-relevant roles.