1. What You Will Learn: Advanced Tableau & Data Visualization Skills
At Skillfloor, you will develop practical Tableau and data visualization expertise focused on real-world business reporting, dashboards, and analytics. This program helps you think like a data analyst and understand how raw data is transformed into clear, interactive insights used in decision-making.
-
Visual Data Thinking: Learn how to interpret data visually and design meaningful dashboards that communicate insights clearly.
-
Data Connectivity & Preparation Techniques: Understand how to connect multiple data sources and prepare datasets for accurate visualization in Tableau.
-
Dashboard Design Fundamentals: Learn how to build structured, interactive dashboards using charts, filters, and calculated fields.
-
Data Analysis & Insight Building: Develop the ability to analyze datasets and convert them into actionable business insights.
-
Interactive Reporting Skills: Create dynamic reports with drill-down features, filters, and user-friendly visual navigation.
-
Data Storytelling Techniques: Learn how to present data in a structured narrative format for better business understanding.
-
Performance Optimization Basics: Understand how to improve dashboard performance and handle large datasets efficiently.
-
Business Decision Support Skills: Develop the ability to support business decisions by creating clear, visual, and data-driven reports.
2. Skills You Will Gain: Industry-Level Tableau & Data Visualization Skills
Develop strong, job-ready Tableau and data visualization skills that are in demand across IT companies, analytics teams, and business intelligence environments. Skillfloor’s practical training ensures you are prepared to convert raw data into meaningful insights through real-world dashboards and reporting systems.
-
Data Visualization Expertise: Learn how to transform complex datasets into clear, interactive, and visually meaningful dashboards.
-
Dashboard Performance Optimization: Improve dashboard speed, responsiveness, and usability for better user experience and decision-making.
-
Data Insight Interpretation: Identify trends, patterns, and anomalies in data to generate actionable business insights.
-
Tool-Based Technical Skills: Work confidently with Tableau Desktop, Tableau Public, and data connectivity tools used in industry environments.
-
Dashboard Workflow Understanding: Understand how data flows from source systems into dashboards for reporting and analysis.
-
Data Accuracy & Validation Awareness: Ensure consistency and correctness of data used in visualization and reporting outputs.
-
Cross-Functional Collaboration Skills: Work effectively with business, analytics, and technical teams to deliver meaningful reports and dashboards.
-
Real-World Visualization Execution: Apply Tableau skills to live business scenarios and create professional-grade dashboards for decision-making.
3. Tableau Analyst Course Fee Structure in India (2026)
-
Basic Data Visualization Courses (1–3 Months): Rs. 15,000 – Rs. 40,000
-
Advanced Certification Courses (3–6 Months): Rs. 40,000 – Rs. 2,00,000
-
Professional/Diploma Programs (6–12 Months): Rs. 1,00,000 – Rs. 5,00,000
-
Executive Data Analytics Programs (12+ Months): Rs. Rs. 3,00,000 – Rs. 10,00,000
Skillfloor Course Fee Structure:
Skillfloor’s Certified Tableau Analyst course is priced at just Rs. 14,900, offering advanced Tableau training, live dashboard projects, internship, certification, and career support, making it one of the most cost-effective professional data visualization programs in India.
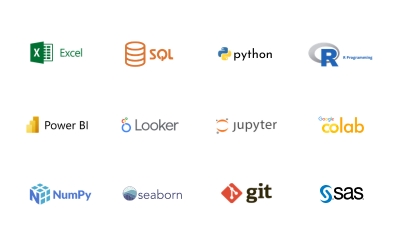
4. Tools & Platforms You Will Work On at Skillfloor
In today’s data analytics industry, employers expect hands-on experience with real visualization and reporting tools. Skillfloor focuses on practical training so you become confident in building interactive dashboards, analyzing data, and working with industry-standard platforms used in modern business intelligence environments.
-
Data Visualization & Reporting Tools: Tableau Desktop, Tableau Public, Tableau Server for creating interactive dashboards and visual reports.
-
Data Preparation & Connectivity Tools: Excel, Google Sheets, Tableau Prep for cleaning, structuring, and preparing data for visualization.
-
Database & Query Tools: SQL, MySQL, PostgreSQL for extracting and managing data from structured databases.
-
Cloud Data Platforms: AWS, Google Cloud Platform, Microsoft Azure for accessing and analyzing cloud-based datasets.
-
Business Intelligence & Analytics Tools: Power BI, Tableau integrations, and reporting tools for generating insights and business dashboards.
5. Course Outcomes: Tableau Analyst Career Readiness
After completing the Certified Tableau Analyst program at Skillfloor, you will gain practical, job-ready data visualization skills that prepare you to confidently start or advance your career in data analytics and business intelligence roles. The program focuses on real-world dashboards, hands-on Tableau usage, and project-based learning to ensure strong professional outcomes.
Key Achievements
-
You will learn how to design and build interactive dashboards that transform raw data into clear, visual insights for effective business decision-making.
-
You will gain the ability to analyze datasets and create meaningful reports using charts, filters, calculated fields, and advanced visualization techniques in Tableau.
-
You will develop skills to connect and prepare data from multiple sources, ensuring accurate and structured inputs for visualization and reporting.
-
You will understand how to create dynamic and user-friendly dashboards that support real-time analysis and business intelligence requirements.
-
You will master techniques to optimize dashboard performance, improve visualization quality, and present data in a clear and impactful way.
-
By the end of the program, you will build a strong professional portfolio with real-world Tableau dashboard projects that demonstrate your ability to analyze data and create impactful visual stories for business decision-making.
6. Program Highlights and Career Assistance
-
Placement Assistance: Get 100% placement support with complete guidance on resume building, Tableau portfolio development, interview preparation, and access to hiring networks in data analytics and business intelligence domains to improve your job opportunities.
-
Certification: Earn Skillfloor’s Certified Tableau Analyst certification with FutureSkills Prime and NASSCOM recognition, along with a shareable LinkedIn certificate validating your data visualization and Tableau skills.
-
Internship Experience: Work on real-world data visualization projects through a 1-student–1-project approach, building interactive dashboards, performing data analysis, and creating business intelligence reports using Tableau.
-
Course Coverage: Learn core Tableau and data visualization areas, including dashboard design, data connectivity, data preparation, SQL basics for analytics, visualization techniques, and reporting concepts.
-
Program Duration: 6 weeks of advanced training followed by 6 weeks of hands-on practice and real-time Tableau dashboard project work.
-
Learning Methods: Choose from online, offline, or hybrid formats with practical assignments, live sessions, and real-time data visualization exercises for better understanding.
-
Career Support: Get access to interview preparation sessions, mock tests, career mentoring, resume building, and LinkedIn profile optimization for data analyst and Tableau-based job roles.
7. AI Role in Tableau & Data Visualization: Future-Ready Analytics Skills
In Skillfloor’s Certified Tableau Analyst Course, you will learn how artificial intelligence is transforming data visualization and how to apply AI-powered techniques in modern analytics environments. AI is now an important part of data analysis, automated insights, and smart dashboards, and modern Tableau professionals must understand how to work with intelligent tools to improve reporting and decision-making.
What you’ll learn about AI in Tableau & Data Visualization:
-
Understand how AI improves data analysis by identifying patterns, trends, and insights from large datasets to support faster and smarter decision-making through dashboards.
-
Learn how to use AI-powered features and tools for automating data preparation, generating insights, and enhancing dashboard creation efficiency.
-
Explore how AI enhances predictive analytics, smart recommendations, and real-time data insights to improve business intelligence and reporting accuracy.
Why it matters for your career:
-
Employers are looking for data professionals who can work with AI-enabled analytics tools such as smart visualization platforms, automated reporting systems, and modern BI tools like Tableau integrated with AI capabilities.
-
With AI-driven Tableau skills, you can create smarter dashboards, generate faster insights, improve reporting accuracy, and deliver more impactful data visualizations in real-world business environments.
8. Job Roles, Salaries & Growth Opportunities
Skillfloor’s Certified Tableau Analyst Course equips you with in-demand data visualization and business intelligence skills and prepares you for high-growth roles in analytics, reporting, and BI domains across India and global markets, with strong salary potential and long-term career advancement opportunities.
-
Tableau Analyst / Data Visualization Analyst: Design interactive dashboards, analyze datasets, and present insights using Tableau for business decision-making.
Salary: Entry-level professionals typically earn Rs. 4 – Rs. 10 LPA, with higher growth as they gain experience in advanced Tableau features and analytics projects.
-
Business Intelligence (BI) Analyst: Create reports, dashboards, and data visualizations to support business strategy and performance tracking.
Salary: Professionals can expect Rs. 5 – Rs. 12 LPA, depending on skills in BI tools, SQL, and data storytelling.
-
Data Analyst: Analyze structured data, generate insights, and support business decisions using visualization and reporting tools.
Salary: Entry-level professionals typically earn Rs. 4 – Rs. 8 LPA, with growth based on analytics and dashboard expertise.
-
Reporting Analyst: Develop automated reports and dashboards to track KPIs, business performance, and operational metrics.
Salary: Professionals can expect Rs. 4 – Rs. 9 LPA, depending on experience with reporting tools and data visualization platforms.
-
MIS Analyst: Manage, analyze, and present business data in structured reports and dashboards for management decision-making.
Salary: Entry-level professionals typically earn Rs. 3.5 – Rs. 8 LPA, with higher growth in advanced analytics roles.
Career Growth Opportunities
-
Expanding Demand for BI & Data Visualization Experts: Organizations across IT, finance, retail, healthcare, and e-commerce are heavily investing in dashboards and real-time reporting for faster, data-driven decisions.
-
Strong Global Adoption of Tableau Skills: Tableau is widely used by global enterprises, opening opportunities in international companies, remote analytics roles, and global consulting projects.
-
Accelerated Career Progression in Analytics Roles: With strong Tableau skills, professionals can quickly transition from junior analyst positions to mid and senior-level business intelligence roles.
-
Advanced Career Pathways in Analytics & BI: Skilled professionals can move into high-impact roles such as BI Developer, Senior Data Analyst, Analytics Consultant, or Data Visualization Lead with increased responsibility and pay growth.
9. Skillfloor Certified Tableau Analyst Courses List
-
Certified Data Analysis Professional
-
Certified Business Analytics Professional
-
Certified Tableau Analyst
-
Certified Power BI Analyst
10. Syllabus / Topics Covered in Certified Tableau Analyst Program
This program is designed to build strong Tableau and data visualization skills through core analytical concepts, dashboard design principles, and hands-on practical training. It begins with foundational data understanding and gradually advances into interactive dashboards, business reporting, and real-world visualization projects. The training includes live projects and lab exercises to ensure real-world, job-ready expertise.
1. Basics of Data Visualization & Tableau: Understand how data is transformed into visual insights using Tableau. This module builds a strong foundation in charts, graphs, and visualization principles.
2. Data Connection & Preparation in Tableau: Learn how to connect multiple data sources, clean datasets, and prepare data for visualization and reporting.
3. SQL for Data Analysis: Understand basic SQL concepts, including queries, filtering, joins, and data extraction for Tableau reporting.
4. Dashboard Design Fundamentals: Learn how to create structured, interactive, and user-friendly dashboards for business insights.
5. Charts & Visualization Techniques: Study different chart types like bar charts, line charts, pie charts, maps, and advanced visuals used in Tableau.
6. Calculated Fields & Data Analysis: Learn how to create calculated fields, apply formulas, and generate meaningful insights from raw data.
7. Interactive Dashboards & Filters: Understand how to build dynamic dashboards using filters, parameters, and drill-down features.
8. Data Storytelling & Reporting: Learn how to present data in a structured storytelling format for better business decision-making.
9. Tableau Tools & Platforms: Work with Tableau Desktop, Tableau Public, and Tableau Server for building and sharing dashboards.
10. Live Projects & Practical Training: Work on real-world Tableau projects, including business dashboards, sales reports, and analytics visualizations to build job-ready skills.
The Certified Tableau Analyst program at Skillfloor builds strong expertise in data visualization and business intelligence through practical, industry-focused learning. It helps you develop hands-on skills in creating interactive dashboards, analyzing data, and turning information into clear business insights. With live projects and real-world training, you gain confidence in using Tableau for professional reporting and analytics. This program prepares you to confidently begin your career in data analytics and BI roles with job-ready skills.