Boston is a global hub of innovation and technology, with a thriving job market for data analysts and experts in analytics. Many top-rated universities in Boston offer comprehensive analytics courses that are designed to meet the growing needs of the data-driven industry. These analytics courses equip individuals with the skills required to interpret data, make informed business decisions, and build a successful career in analytics. One prominent institution that offers analytics courses in Boston is Harvard University. The School of Engineering and Applied Sciences at Harvard provides master's and doctoral programs in data science and analytics. The curriculum includes courses in statistics, machine learning, data visualization, data management, and cloud computing. The program is structured to provide students with hands-on experience in solving real-world problems and applying data analytics techniques to make informed business decisions. MIT Sloan School of Management also offers a unique Master of Business Analytics program that combines business knowledge with analytics techniques. The program is ideal for individuals seeking careers in business analytics, consulting, management, and technology. The curriculum includes courses in data modeling, predictive analytics, econometrics, data mining, and optimization. The program offers different analytical tracks, enabling students to specialize in a particular area of interest. Boston University's Questrom School of Business also offers a Master of Science in Business Analytics program designed to equip students with the skills essential to data analytics. This program prepares students for work in organizations such as consulting, finance, healthcare, and marketing. The curriculum includes courses in data governance, marketing analytics, machine learning, data storytelling, and digital analytics. Northeastern University's D'Amore-McKim School of Business offers an MS in Business Analytics program that is designed to provide students with a balanced understanding of the business principles and analytics strategies that drive decision-making. The program curriculum includes core courses in statistics, programming, machine learning, and data visualization, and electives in areas such as healthcare analytics, marketing analytics, financial analytics, and social media analytics. The program is delivered on a part-time or full-time basis, catering to the needs of working professionals. Boston College's Carroll School of Management also offers a Master of Science in Business Analytics program. The curriculum includes courses in data management, business metrics and intelligence, machine learning, and data mining. The program is designed to enable students to apply analytics to solve real-world business problems, and it culminates in a capstone project where students work on addressing an actual business issue. In conclusion, Boston has emerged as a prominent center for data analytics education, with world-class universities offering top-rated programs in the field. These courses provide a comprehensive understanding of the analytical techniques required to make data-driven decisions in the business world. Furthermore, the analytics sector is growing, and the skills these programs provide are highly valued by organizations across industry sectors, making analytics courses in Boston an attractive option for individuals seeking dynamic and rewarding careers.
₹60,000


Watch how students, freshers, and professionals transformed their careers with Skillfloor's Analytics Courses Reviews


Hurry Up!
Limited seats call us now for amazing discounts on Analytics Courses course
Get trained by experienced practitioners who've worked with agencies, brands, and real business growth projects.

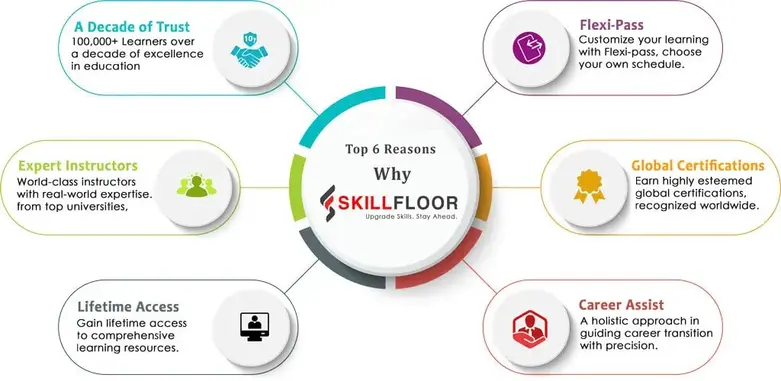
Skillfloor is a Government-Recognized Skill Development Institute under Startup India (DPIIT), offering career-focused certification programs in Analytics, Artificial Intelligence (AI), Data Science, Digital Marketing, SEO, and related domains. As one of India's largest training institutes, our courses emphasize hands-on projects, expert mentorship, and skills aligned with real hiring needs. With flexible learning options - online, offline, and hybrid, plus 100% scholarships for selective students, we make quality, job-ready education accessible.
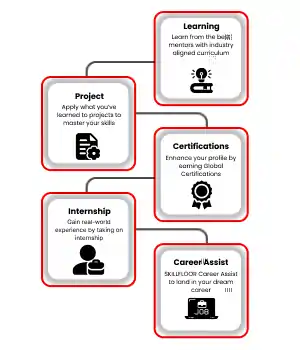
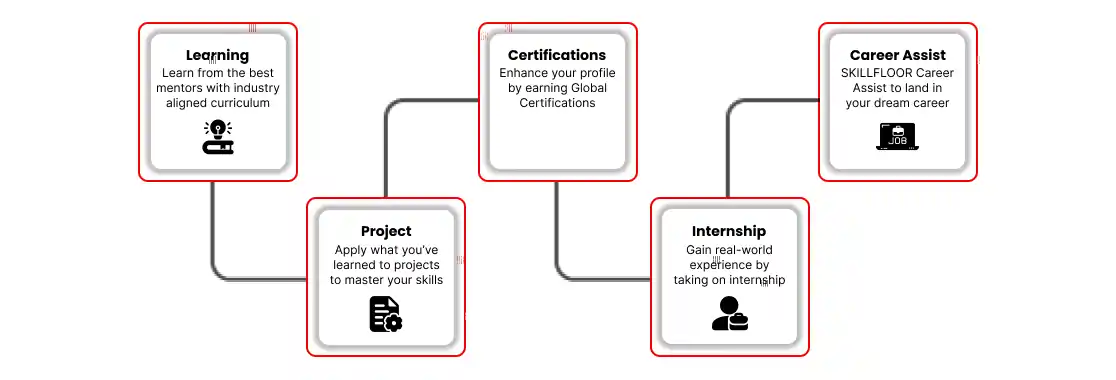
Explore the program that aligns with your goals and take the next step with Skillfloor.
- Overview of data analysis and its importance in business
- Types of analytics: Descriptive, Predictive, Prescriptive
- Role of data in decision-making processes
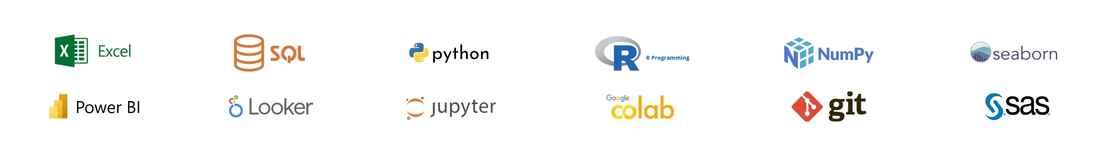
- Introduction to common tools: Tableau, PowerBI, Excel
- Ethical considerations in data collection and analysis
- Data sources: Primary and secondary data
- Data collection methods (surveys, web scraping, databases)
- Data cleaning techniques (handling missing values, outliers)
- Data transformation and feature engineering
- Data storage concepts (structured vs. unstructured data)
- Descriptive statistics: Mean, median, mode
- Data visualization basics (histograms, scatter plots)
- Identifying data patterns and trends
- Outlier detection and handling methods
- Correlation and causation analysis
- Inferential statistics and probability theory
- Hypothesis testing (t-tests, chi-square tests, ANOVA)
- Measures of central tendency and variability
- Confidence intervals and margin of error
- Regression analysis: Linear and logistic regression
- Principles of effective data visualization
- Types of charts and their uses (bar, line, pie, heatmaps)
- Designing dashboards for different audiences
- Interactive visualization techniques
- Data storytelling for impactful presentations
- Time series analysis and forecasting methods
- Clustering and segmentation analysis
- Decision trees and classification techniques
- Introduction to machine learning in business analytics
- Model evaluation and selection
- Basics of SQL for data manipulation
- Creating databases and relationships
- Aggregating data with SQL (GROUP BY, JOIN)
- Data modeling for business intelligence (star and snowflake schemas)
- Case study: Building a business model with SQL
- Connecting and preparing data in Tableau
- Creating basic visualizations (charts, maps)
- Advanced Tableau functions (LOD calculations, table calculations)
- Building interactive dashboards and stories
- Publishing and sharing visualizations on Tableau Server/Online
- Introduction to PowerBI workspace and components
- Data import and transformation with Power Query
- Data modeling and relationships in PowerBI
- Creating and customizing visualizations
- Publishing and collaborating on PowerBI Service
- Selecting a real-world dataset for analysis
- Defining business questions and objectives
- Conducting data analysis and visualization
- Presenting findings in a comprehensive dashboard
- Peer review and feedback on project