


Data Analytics Tools and Techniques for Beginners
Explore essential data analytics tools and techniques for beginners. Master the basics with key insights and resources for effective data analysis.
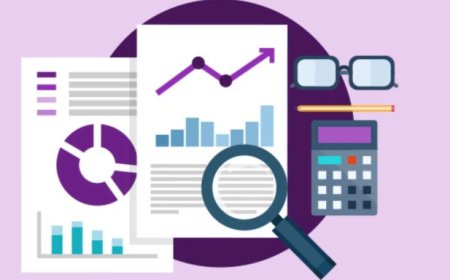
Data Analytics is like solving puzzles with numbers to help make smarter decisions. Imagine you have a bunch of numbers - that's your data. Data Analytics is using tools and tricks to understand what those numbers are telling you. It's like detective work for numbers, helping you see patterns and stories in a sea of information.
Why is this important? Well, think about it this way: Have you ever had so many choices that you didn't know which one to pick? Data Analytics helps businesses and people make choices by showing them what the numbers say. It's like having a superpower to understand trends, predict outcomes, and make decisions that can lead to success.
Data Analytics
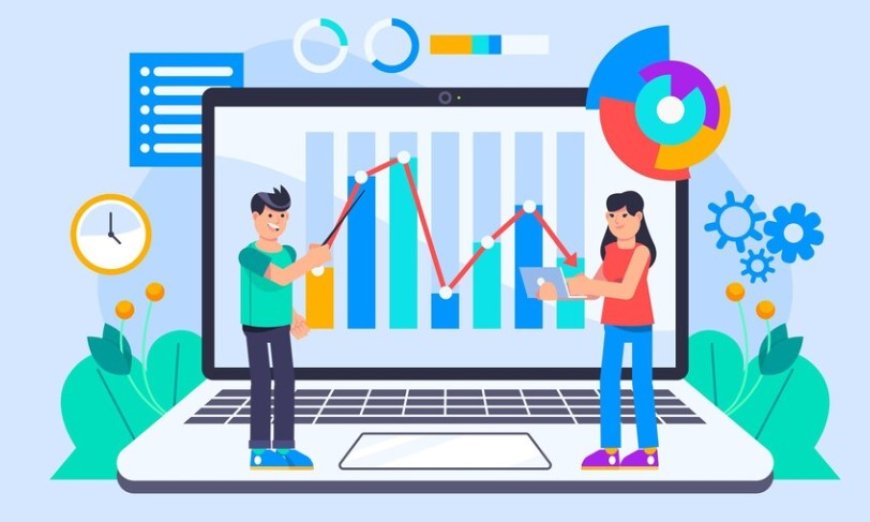
In today's world, data analytics is like the superhero of information. Imagine it as a tool that helps us make sense of all the information we have. It's growing fast and is super important. Think of it as the cool kid in the tech world.


Why is it so cool? Well, it helps businesses and people make smarter decisions. For example, imagine you have a favorite ice cream flavor. Data analytics can tell a store which flavors are popular and when they're most loved. That way, you always get your favorite scoop!
Now, data analytics is not just for ice cream shops. It's used in many industries, like health, finance, and even sports. Doctors use it to understand diseases better, banks use it to keep your money safe, and sports teams use it to up their game. It's like magic for making things work better.
So, in simple words, data analytics is the magic wand that helps everyone—from ice cream shops to hospitals—make smarter and cooler choices. It's not just a tool; it's a superhero making the world a better place!
Challenges Faced by Beginners in Data Analytics
Starting with data analytics can feel like learning a new game. But, hey, every game has its challenges, right? Here are some tricky parts that beginners might face:
-
Tool Troubles: Imagine having many different toys but not knowing which one to play with. Beginners might find it confusing to pick the right tool for the job. But don't worry, it gets easier with practice!
-
Data Dilemmas: Picture having a big puzzle with missing pieces. That's how dealing with different types of data can feel. Beginners might get puzzled with data variety, but with time, they learn how to put the pieces together.
-
Result Confusion: Think of data analytics like telling a story. Sometimes, beginners might struggle to understand the story the data is trying to tell. But, hey, practice makes perfect!
-
Jargon Jumbles: Data analytics has its own language. Beginners might feel like they're in a foreign country without a translator. But no stress, understanding the language comes with time.
So, yes, there are a few bumps at the start, but remember, even the best gamers were once beginners. With practice and a bit of patience, these challenges become stepping stones to becoming a data analytics pro!
What are the essential Data Analytics Tools?
Alright, let's break down the essentials of Data Analytics for beginners without getting too technical.
Essential Data Analytics Tools for Beginners
First up, we have Microsoft Excel. You might be thinking, "Wait, isn't that just for making spreadsheets?" Well, yes, but it's also a superhero in the data world. Excel helps you organize and analyze data in a simple way. It's like the starting point for many data adventures.
Next on the list is Google Analytics. Imagine you have a website, and you want to know how many people visit and what they do there. That's where Google Analytics comes in. It helps you understand your website's performance. No capes, just simple insights.
Then, we have Tableau. Don't worry; it's not a fancy French dish. Tableau is a tool that turns your data into visual stories. You can create cool charts and graphs without needing a PhD in computer science. It's like the Picasso of data representation.
How to Choose the Right Tool
Now, the big question: How do you pick the right tool for your data adventure? First off, think about your data—what type is it, and where does it come from? If you have lots of numbers, Excel is your buddy. If you're a website owner, Google Analytics is your go-to. Tableau? Well, that's for turning data into art.
Consider how big your data is and how quickly it's growing. That's what we call scalability. If you're dealing with mountains of data, you might need a tool that can handle the load without slowing down. But if you're just starting, a simpler tool like Excel might be your sidekick.
Learning curve is like asking, "How easy is it to use?" Some tools are like riding a bike—easy to pick up. Others are more like learning to juggle—it takes time. Pick a tool that matches your skill level. You don't want to feel like you're swimming in shark-infested waters when you're just starting to dip your toes in.
Community support is crucial. If you get stuck, you'll want help, right? Check if there's a community or people online who can answer your questions. Excel has a massive community; Google Analytics has forums, and Tableau has its own fan club.
Common Data Analytics Techniques for Beginners
Now, let's talk about the fun stuff—what you can do with these tools. Think of descriptive analytics as telling a story about your data. It's like describing the who, what, when, and where. Imagine you have a box of chocolates; descriptive analytics is explaining which chocolates are the most popular.
Inferential analytics is like guessing the future. It takes a small piece of data and makes a big prediction. If you know your friend likes caramel-filled chocolates, you might infer they'll love a new caramel-flavored ice cream.
Predictive analytics is the real fortune teller. It looks at your data and says, "Hey, based on what I see, here's what might happen next." It's like predicting that if your friend loves caramel-filled chocolates, they might also enjoy a caramel latte.
Lastly, prescriptive analytics is like having a wise grandparent giving advice. It not only predicts but also tells you what to do about it. If your friend loves caramel-filled chocolates and caramel lattes, prescriptive analytics might suggest trying a caramel cake.
These techniques are like different tools in your superhero belt. Descriptive tells the story, inferential and predictive predict the future, and prescriptive guides your actions. You don't need a PhD to start; just pick the one that fits your data adventure.
So there you have it—the basics of Data Analytics for beginners. It's not about complicated algorithms or mind-bending equations; it's about using simple tools to make sense of the information around you. Happy data exploring!
To all the beginners stepping into the world of data analytics, you're on an exciting journey! Learning might seem a bit challenging at first, but remember, even superheroes had to start somewhere. Keep practicing, and soon you'll be weaving magic with data.
Looking ahead, the future of data analytics is like an open book waiting for your story. Expect more user-friendly tools and even cooler ways to use data. Embrace the adventure, stay curious, and who knows, you might be the next superhero making waves in the world of data analytics!