


Beginner’s Guide to Financial Data Analytics
Learn the basics of Financial Data Analytics. Explore key concepts, tools, and applications to analyze financial data for better decisions and valuable insights.
Have you ever wondered how a few numbers might help you better comprehend your money? You may accomplish it with the use of financial data analytics. It transforms revenue and costs into simple data. From small company owners to students, a lot of people use it every day to keep tabs on their spending and make more informed financial decisions.
Financial data helps big businesses make informed decisions, and you can too. Learning to understand budgets and reports may help anybody become more confident with money. It's an easy method for avoiding errors, improving planning, and coming to conclusions that feel good and work.
What is Financial Data Analytics?
The main goal of financial data analytics is to understand numerical data. It enables you to see where your money is going and where it is coming from. Whether you're managing your household budget or operating a business, this basic ability may help you see trends, identify issues, and make smarter financial decisions every day.
Spreadsheets, reports, and other tools can help you gain a comprehensive understanding of your finances. This procedure frequently involves financial analysis, which entails examining revenue, costs, and patterns in more detail. It is accessible to anybody; it is not only for specialists. Taking little measures might help you gain complete financial control.


Understanding the Role of Financial Data Analytics in Modern Finance
-
Smarter Financial Decisions: There is more to finance than simply numbers these days. These days, people utilize tools and reports to better understand their finances and make informed, easy-to-follow decisions based on factual information.
-
Business Growth Planning: To expand, businesses look at revenue, costs, and profit. Simple reports help small and large organizations plan forward with greater certainty and less guessing by highlighting what is and is not working.
-
Early Risk Detection: Data analytics helps identify financial issues before they become more serious. It provides early warning indicators so that timely action may be made by monitoring expenditure patterns or income declines.
-
Safe Lending Choices: Banks utilize technologies to examine a person's payment patterns and history. This aids in determining if they can provide loans in a safe manner without running into issues with later collection.
-
Better Investment Picks: Investors look at price fluctuations, market trends, and historical performance. This lowers risk, helps them avoid investing in the wrong locations, and helps them pick wisely.
-
Family Budget Help: Families may use basic tracking to control spending even at home. Reports and charts that illustrate the flow of money make it simpler for people to save and accomplish their financial objectives.
Breaking Down the Types of Financial Data
-
Transaction Data: Every financial transaction, including purchases, bills, and salaries, is documented here. You may better understand where money comes from, where it goes, and how spending patterns change by keeping a daily record of these entries.
-
Financial Statements: The health of an organization is displayed in reports such as the cash flow statement, balance sheet, and income statement. They make it simpler to make confident and understandable decisions about future activities by disclosing earnings, debts, and resources.
-
Market Data: This is where interest rates, stock prices, and currency rates decline. To better grasp these figures and make more informed trading and financial decisions based on patterns and unambiguous facts, many people enroll in analytics courses.
-
Budget Data: This kind compares your actual expenses to your expected spending. To effectively achieve your financial objectives, it's a fantastic method to identify waste, manage spending, and modify your money habits.
-
Forecast Data: Using historical data and market patterns, this forecasts future revenue or costs. It helps both individuals and businesses make better decisions, lower risks, and get ready for changes.
-
Customer Financial Data: Includes past payments, spending patterns, and credit scores. Businesses utilize it to lower loan risks, improve customer service, and uphold enduring, dependable client relationships in order to succeed over the long time.
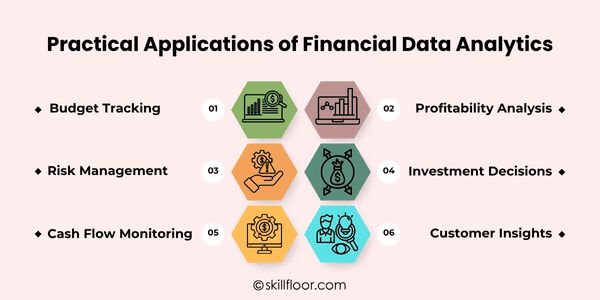
Practical Applications of Financial Data Analytics
-
Budget Tracking: Helps both people and businesses keep a careful eye on their earnings and outlays. It's simpler to keep expenses under control, prevent overspending, and make informed decisions about investing and saving when actual spending is contrasted with planned budgets.
-
Profitability Analysis: Shows which goods, services, or regions generate the most profits. In the long run, this helps choose where to invest time, effort, and resources for higher returns and more robust financial performance.
-
Risk Management: Helps in identifying issues before they become serious. Businesses can take prompt action, prevent significant losses, and successfully safeguard their entire financial health by monitoring warning indicators in sales, costs, or debts.
-
Investment Decisions: Investors can examine historical trends, corporate performance, and market patterns through data analysis. This reduces the chance of losing money on poor possibilities and makes it simpler to select secure, lucrative investments.
-
Cash Flow Monitoring: Monitors the flow of money in and out. Without compromising future development or placing undue financial strain on operations, careful monitoring guarantees there is adequate money for payments, everyday necessities, and emergencies.
-
Customer Insights: Analyzing consumer purchasing patterns and payment histories enables companies to develop better products and services. Relationships are strengthened, loyalty is increased, and clients are guaranteed to obtain solutions that precisely meet their demands.
Tools & Technologies in Financial Data Analytics
-
Excel and Google Sheets: Tools for recording income, spending, and budgets that are easy for beginners to use. They enable anyone to comprehend their finances without requiring complex technical knowledge by converting numbers into understandable images using straightforward algorithms and charts.
-
Power BI: An application for business information that generates dynamic dashboards and reports. It enables businesses to compare outcomes, see patterns fast, and make sure decisions are based on readable and understandable visual insights.
-
Tableau: Creates simple, colorful graphics from complicated financial data. Many individuals use it because it's great for identifying patterns and trends and because they prefer clear pictures over big, difficult-to-read spreadsheets.
-
Python: Programming language that is adaptable for sophisticated analysis. It offers deeper insights, automation, and custom reports with useful libraries for users who are prepared to go beyond simple spreadsheet computations.
-
SQL Databases: Perfect for handling big financial documents. Without having to manually search through lengthy files, SQL enables speedy data organization, sorting, and filtering, assisting users in finding the precise information they want.
-
APIs for Market Data: Make historical and current market data accessible. These technologies allow companies and investors to make timely and well-informed financial choices by tracking stock prices, currency fluctuations, and economic developments.
The Workflow of Financial Data Analytics
-
Data Collection: Obtaining financial data from several sources, such as bank statements, sales reports, and invoices, is the first stage. You can better grasp the big picture by using this raw data as the basis for your study.

-
Data Cleaning & Preparation: The data is then examined for errors, duplication, and missing values. Accuracy and trust are ensured by clean data. Additionally, it is simpler to deal with organized data when conducting analysis or creating reports.
-
Exploratory Data Analysis (EDA): EDA facilitates data exploration and comprehension. Simple summaries and charts highlight issues, trends, or patterns. Prior to developing models or making financial judgments, this phase establishes a solid knowledge.
-
Feature Engineering: This stage involves adding or creating relevant information from the data. You might compute monthly growth or profit margins, for instance. Future analysis is strengthened and clarified by these additional characteristics.
-
Model Building: Here, basic models or rules are developed to identify patterns or make predictions. Using the data you've produced, this may entail predicting costs, identifying danger areas, or seeing possibilities.
-
Visualization & Reporting: The last stage transforms the findings into simple graphics, such as dashboards, charts, or summary reports. This makes it easy for everyone to comprehend insights and act wisely, including those who are not in the banking industry.


Common Use Cases of Financial Data Analytics
-
Stock Price Prediction: Examines historical stock prices in order to identify trends. forecasts future trends based on daily movements and market history, assisting investors in making more informed decisions.
-
Portfolio Optimization: Helps in selecting the appropriate asset mix. seeks to strike a balance between return and risk so that investors may benefit from consistent growth without incurring needless financial risks.
-
Credit Risk Modeling: Determines a person's likelihood of repaying a debt. helps lenders avoid making dangerous loan selections by using information such as income and payment history.
-
Fraud Detection: Keeps an eye out for odd transactions. conserves money and safeguards consumer accounts by assisting banks and businesses in promptly identifying and preventing fraud.
-
Sentiment Analysis from Financial News: Examines news articles and headlines to gauge popular sentiment. Media sentiment, whether favorable or unfavorable, can affect stock movements and market behavior.
-
Customer Segmentation for Financial Products: Groups clients according to their spending, income, or habits. makes it simpler to provide each group with the appropriate goods, such as savings programs, credit cards, or loans.
Key Concepts in Financial Data Analytics
-
Descriptive Analytics: This makes it easier for you to comprehend what has already occurred. In order to display distinct trends and company performance, it compiles historical financial data, such as sales, costs, and profits.
-
Diagnostic Analytics: Used to determine the cause of an incident. This examines more data to determine the cause of a decline in profitability, such as declining sales or increased expenses.
-
Predictive Analytics: Examines historical patterns to make educated guesses about potential future events. It is useful for predicting upcoming market behavior, cash flow, or sales.
-
Prescriptive Analytics: Makes recommendations based on facts. To increase profitability or cash flow, for instance, it can suggest cutting expenses or spending more on marketing.
-
Real-time Analytics: Keeps track of financial information in real time. Companies use it to keep tabs on expenditures, identify problems promptly, and react swiftly to shifts in expenses or sales.
-
Data Visualization: Converts difficult numbers into simple graphs or charts. People may rapidly grasp financial facts without having to read lengthy reports or spreadsheets thanks to this.
Challenges in Financial Data Analytics
-
Data Quality Issues: Incorrect or missing data might produce negative outcomes. Making wise financial decisions and avoiding errors are based on clean and reliable data.
-
Data Overload: Excessive data might be perplexing. People who lack attention risk missing important discoveries or spending too much time staring at irrelevant statistics.
-
Lack of Skills: Many people have trouble interpreting data or using technologies. It's challenging to evaluate financial data and interpret its true meaning without a foundational understanding.
-
Privacy and Security Risks: Financial information is delicate. Improper handling may result in leaks, privacy violations, or a decline in confidence from clients or business associates.
-
Poor Integration Between Systems: Software and tools may not function well together. As a result, gathering and connecting financial data from several sources in one location becomes more difficult.
-
Misinterpretation of Data: It is simple to interpret data incorrectly in the absence of clear illustrations or explanations. Missed chances and bad business decisions may result from this.
Comprehending your financial situation doesn't have to be challenging or challenging. Anyone, from students to company leaders, may make better decisions by simply improving their ability to understand and interpret statistics with the help of financial data analytics. Today's technologies and strategies make it simpler than ever to maintain control, whether it's through budgeting, expenditure tracking, or goal setting. Keep in mind that tiny actions might result in significant advancements as you continue to research this area. You'll gain confidence in managing your finances and making choices that genuinely advance your objectives with constant education and practice. Everyone may get financial clarity with the correct attitude and a little curiosity; it's not only for specialists.