


What Is Linear Regression in Data Science?
Learn what linear regression is in data science, how it helps find the link between two variables, and why it's useful for making clear and simple predictions.
How can we determine whether price and size are related? We employ a simple method known as linear regression in a lot of actual tasks. What's that? Because it makes it apparent how one thing influences another. It has been dependable for years, is simple to use, and aids users in making better decisions regarding their data.
The simplicity and clarity of linear regression make it a generally regarded method. It is utilized by professionals in fields such as retail, health, and real estate to comprehend and forecast results. The data may be plotted, a line drawn, and the pattern observed. For years, it has been taught to assist individuals in making informed decisions based on actual data rather than conjecture.
What Is Linear Regression?
One easy way to determine the relationship between two items is to utilize linear regression. For example, it can show the relationship between price and housing size. The trend is displayed by drawing a straight line through the data points. This facilitates comprehension and prediction of future values.
Because it is simple to understand and interpret, linear regression is often used. It performs best when there is a distinct pattern in the data. This technique allows you to see how one value changes about another, whether you're looking at temperature, height, or sales. In many real-world scenarios, it's an effective tool.


The Foundational Role of Linear Regression in Data Science
-
Easy Start for Learning: One of the first techniques people learn is linear regression. It helps in demonstrating the connection between two items. It is a solid foundation for learning more about data science because of this straightforward concept.
-
Solves Real Problems: Linear regression may be used to address a lot of real-world issues, such as prices or sales. It contributes to the development of outcomes trust, which is crucial for data science jobs.
-
Simple and Quick Results: The approach provides fast responses and is simple to use. It is a popular option for early projects as it makes patterns easier to comprehend without requiring complicated processes.
-
Shows Clear Trend: Linear regression reveals trends with a small amount of numbers. You can see the relationship between one item and another, which is helpful in a variety of fields, including business, education, and health.
-
Good for Beginners: Beginners will find it to be an excellent place to start. It is simpler to transition to more complex techniques used in larger projects after you have a solid understanding of linear regression.
-
Helps Test Ideas Fast: Many teams utilize it as a first step since it is straightforward and dependable. In order to keep things clear and on course, it helps quickly test concepts before deciding on more involved techniques.
Types of Linear Regression
-
Simple Linear Regression: This is the most fundamental kind. It examines the connection between a single input and an output. You could, for instance, research the relationship between a house's size (input) and price (output). The outcome is a trend-indicating straight line.
-
Multiple Linear Regression: This kind predicts a single outcome using two or more inputs. For instance, to estimate the cost, one may consider the house's age, size, and number of rooms. When a lot of factors influence the result, it provides a better picture.
-
Polynomial Regression: Data can occasionally deviate from a straight line. Polynomial regression can better match the data by producing a curved line. The concept remains the same, but it gives the trend more structure.
-
Ridge Regression: This particular form of multiple linear regression is unique. When there are too many inputs in your data or some of them are similar, it helps. By lowering the possibility of unclear or disorganized findings, ridge regression makes things straightforward.
-
Lasso Regression: Similar to ridge regression, lasso helps with model cleanup. Even inputs that don't contribute much value can be eliminated. When dealing with large amounts of data, this helps to keep your model modest and focused.
-
Logistic Regression: Despite having the word "regression" in its name, logistic regression is frequently used to provide yes/no answers, such as whether a consumer will make a purchase. Although the objective is distinct, several mathematical concepts are shared.
How Linear Regression Works in Data Science
-
Finds Patterns in Data: Linear regression analyzes the relationship between two variables, such as price and sales. It illustrates the trend with a straight line, which makes patterns simpler to spot and comprehend.
-
Uses Past to Predict: It predicts future outcomes by analyzing historical data. For instance, you may predict what will happen next if you are aware of previous sales. It's a clever method of making wiser decisions.
-
Measures Strength of Links: This technique shows the strength of the connection between two things. Changes in one variable have a greater impact on the other when the connection is higher.
-
Follows Clear Steps: Simple procedures are used in linear regression: gather data, plot it, draw a line, and determine how close the points are to one another. These procedures adhere to the basic principles of data science in a simple way.
-
Easy to Show and Explain: It may be drawn on a screen or on paper. Everyone, not only professionals, can understand the line. This facilitates the exchange of ideas among groups or customers.
-
Helps Start Bigger Projects: In many projects, it's the first tool employed. Teams can choose whether they require additional in-depth research or deeper methodologies once it provides a basic response.
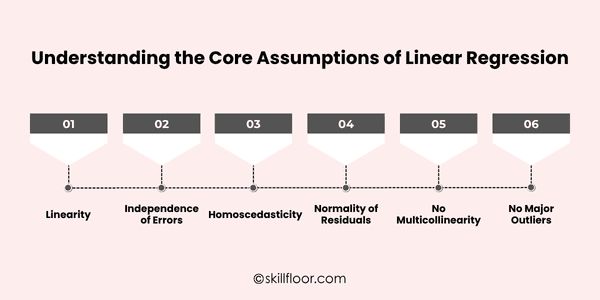
Understanding the Core Assumptions of Linear Regression
-
Linearity: A straight-line relationship between input and output is ideal for linear regression. The outcomes might be inaccurate if there is a curved or ambiguous relationship between the two.
-
Independence of Errors: Prediction errors ought to be isolated from one another. In the event that one mistake influences another, the model can produce erroneous patterns, bad choices, or incorrect conclusions.
-
Homoscedasticity: Accordingly, the mistakes ought to be distributed uniformly. No matter how the data alter, the error's magnitude shouldn't increase or decrease. The model may provide poor predictions if the dispersion is uneven.
-
Normality of Residuals: There should be a typical, bell-shaped curve in the residuals, which are the small differences between the actual and predicted values. As a result, the model remains balanced and the findings are more trustworthy.
-
No Multicollinearity: The model should not employ inputs that are excessively similar to one another. It can confuse the model and lower the output quality if two or more inputs say the same thing.
-
No Major Outliers: Excessive numbers that deviate significantly from the norm might skew the findings. It is advisable to verify the data and eliminate or correct any anomalies prior to using the model.
Linear Regression: Step-by-Step Implementation for Data Science
-
Collect the Right Data: Collecting clear and practical facts should come first. Make sure it contains the input and output you wish to examine, such as test scores and study hours or house size and cost.

-
Understand the Data: Give data exploration some time before diving in. Examine charts, look for odd numbers, and identify missing data. This stage enables you to understand the true meaning of the data.
-
Choose Input and Output: Select one output (such as sales) and one or more inputs (such as a product's characteristics). If they don't make sense together, your model won't be useful.
-
Build the Model: Fit a straight line through the data using a basic tool. This line will show, step-by-step, how much the output changes when the input varies.
-
Check the Results: Evaluate the model using fresh data. Check the accuracy of your predictions against the actual outcomes. A decent model will often provide figures that are close to each other.
-
Improve and Use It: Go back, tidy up the data more, or try different inputs if the model isn't doing well. When it functions properly, you may utilize it to guide your decision-making.


Common Pitfalls in Linear Regression and How to Avoid Them
-
Ignoring Data Quality: Incomplete or disorganized data might produce inaccurate findings. Before creating your model, make sure your data is clean, error-free, and free of missing values.
-
Using the Wrong Inputs: The model may become confused if you provide too many or irrelevant inputs. For increased accuracy, concentrate on significant inputs that are directly related to the outcome you're attempting to forecast.
-
Overlooking Outliers: The line may be pulled in the incorrect direction by outliers. Always look for odd numbers in your data and determine whether they need to be eliminated or treated differently.
-
Not Checking Assumptions: The equal distribution of errors and linearity are two characteristics of linear regression. Your model can appear acceptable yet produce subpar or deceptive results if these are not verified.
-
Relying Only on One Test: It is insufficient to look at a single score, such as R2. To properly comprehend the performance of your model, use various checks such as graphs and error size.
-
Skipping Validation: Using the same data to build and test your model is dangerous. When experimenting with fresh data, always divide your data into training and testing sets.
Real-Life Applications of Linear Regression
-
Marketing: Companies employ linear regression to determine the impact of advertising expenditures on sales. It assists marketers in determining which channels yield the most returns on investment for upcoming promotions.
-
Finance: Analysts look for patterns and forecast future prices using historical stock data. Linear regression provides an easy way of comprehending how various market conditions impact stock movements, notwithstanding its shortcomings.
-
Healthcare: Predicting the growth of a disease is one typical application of data science in healthcare. Physicians utilize linear regression to monitor health changes and develop treatment plans based on patient history and test findings.
-
Startups: Startups frequently monitor user growth over time using linear regression. It enables them to determine what features or activities are propelling growth and whether their product is acquiring consumers consistently.
-
Product Pricing Strategy: Linear regression is used by businesses to determine how various factors impact product pricing. It does this by examining the relationship between what individuals are willing to pay and factors like size, quality, or brand value.
-
Website Traffic Prediction: On the basis of historical traffic, content changes, or social media posts, teams utilize it to predict website visits. It facilitates the scheduling of content and the identification of the factors that increase traffic.
Essential Tools and Libraries for Linear Regression in Data Science
-
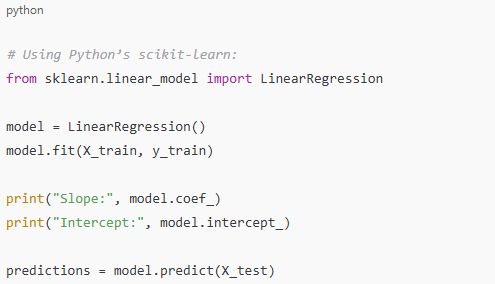
Python (Scikit-learn): Scikit-learn is a Python package that is easy for beginners to use. Its basic features allow you to build, train, and evaluate linear regression models. Because it's simple and effective, it's extensively employed.
-
Statsmodels: Statsmodels is an additional Python package that provides comprehensive results. Errors, confidence levels, and the strength of the data relationships are among the things it displays to help you better understand the model.
-
R (lm function): R was created specifically for statistics. One quick and simple method for creating linear regression models is to use its lm () function. It is widely used for learning and analysis by researchers and students.
-
Microsoft Excel: It's true that Excel can do linear regression. You may create a simple model and see the trendline with a few clicks. It's excellent for fast checks or little tasks.
-
Google Sheets: Similar to Excel, Google Sheets has built-in chart capabilities that allow you to design basic linear regression models. For people who would rather work online or share their achievements with others, it's ideal.
-
Jupyter Notebook: This tool walks you through the process of writing and executing Python code. It's incredibly helpful for displaying data, running models, and providing a clear explanation of your work in one location.
The simple yet effective technique of linear regression helps in our comprehension of the relationships between various variables. In many everyday tasks, it is used, from forecasting home values to creating marketing budgets. Since it is based on actual data and is simple to use and explain, it is trusted. This approach provides a strong basis for you to build upon, regardless of your level of experience with data. Better decisions may be made in every sector with the use of linear regression, clean data, and cautious procedures. Making sense of the most important numbers is dependent on this method.