


Quick and Easy Guide to Classification in Data Science
Learn classification in data science quickly with this easy, step-by-step guide. Perfect for beginners and professionals wanting to master predictive analytics.

"Are you feeling overloaded with data?" Every day, social trends, customer clicks, emails, and numbers increase. Finding the hidden insights that could transform everything seems impossible. How can you balance all of this?
In data science, classification becomes your superpower in this situation. Whether you're a corporate leader, an inquisitive analyst, or an ambitious professional, learning to classify data can help you make decisions that have a significant impact.
We'll break it down step-by-step in this guide using relatable stories, real-world examples, and no technical jargon. By the conclusion, you'll not only comprehend classification, but you'll feel prepared to put it to use right away.
What Is Classification in Data Science?
In data science and machine learning, classification is a crucial idea. To put it simply, it's the process of allocating data to one of many pre-established classes or categories.


In supervised learning, a classification model predicts the category of fresh, unseen data after analyzing labeled examples. For example, depending on historical trends, it may learn to classify emails as "spam" or "not spam."
In other words, a classification model classifies data points into distinct groupings known as classes, much like an advanced sorter. Imagine a mail sorter that uses its capabilities to automatically classify each email into the appropriate folder, such as spam or inbox.
For example:
-
Is this email spam or not?
-
Will a patient develop diabetes based on their health data?
-
Will a customer buy your product or leave your website?
Classification focuses on predicting certain categories or labels for data points, in contrast to regression, which predicts continuous values like sales or income.
Why Classification Matters in Data Science
-
Clear Data Insights: By converting unstructured data into meaningful categories, classification facilitates the understanding of insights and improves the accuracy of judgments.
-
Predict Customer Behavior: Businesses may easily improve strategy and operational efficiency by using it for predicting outcomes like client behavior.
-
Automate Data Sorting: Classification facilitates automated operations by grouping data, which greatly reduces human error and saves time.
-
Achieve Key Goals: Accurate prediction, risk assessment, and a deeper comprehension of intricate patterns in datasets are all made possible by classification for data science objectives.
-
Real-World Applications: In practical applications such as medical diagnosis, targeted marketing campaigns, and fraud detection, it is crucial.
-
Transform Overwhelming Data: Classification converts overwhelming information into useful insights, assisting both novices and experts in making sense of massive datasets.
Types of Classification in Data Science
In data science, there are various forms of classification that are suitable for particular sorts of datasets and challenges. Knowing them enables you to select the best strategy for your project.
1. Binary Classification
Binary classification distinguishes between two possible categories, such as spam and non-spam. It works well in situations with definite, mutually exclusive outcomes or yes/no predictions.
2. Multiclass Classification
In multiclass classification, more than two categories are predicted. For example, datasets with several different classes can be handled by sorting emails into social folders, updates, or promotions.
3. Multilabel Classification
In multilabel classification, a single data point can belong to multiple classes simultaneously, such as tagging a news article as politics, economy, and health.
4. Imbalanced Classification
Imbalanced classification, which is frequently used in fraud detection or the prediction of rare diseases, deals with unequal class distributions in which certain categories are significantly rarer than others.
5. Ordinal Classification
Ordinal classification predicts ordered categories, in which the classes are arranged in a significant order. A product review, for example, has three possible ratings: poor, average, and exceptional.
Choosing the best method for your tasks requires an understanding of various classification kinds. You can successfully learn these ideas by enrolling in a data science course.
How Classification Works in Data Science
1. Data Collection


Collecting relevant data from various sources is the first stage. Model performance is strongly impacted by the quantity and quality of data, hence gathering thorough and clean datasets is essential.
2. Data Preprocessing
Missing numbers, noise, and discrepancies are common in raw data. Preprocessing prepares the data for precise model training and trustworthy predictions by cleaning, normalizing, and transforming it.
3. Splitting Data
Training and testing sets of data are separated. While the testing set assesses how effectively the model generalizes to fresh, untested data, the training set teaches the model patterns.
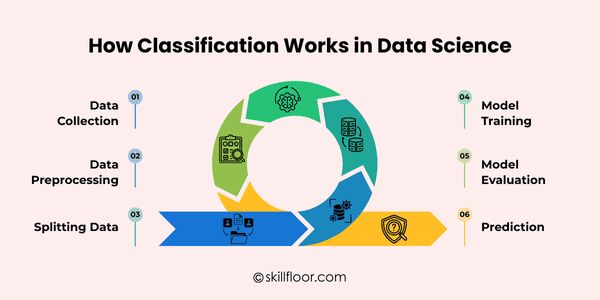
4. Model Training
From the training data, the model picks up linkages and patterns. To efficiently reduce errors and increase forecast accuracy, many data science models modify their characteristics.
5. Model Evaluation
Following training, measures such as accuracy, precision, recall, and F1-score are used to test the model on unknown data. This stage guarantees the model's dependability and efficiency.
6. Prediction
Lastly, categories for fresh data are predicted by the trained and assessed model. These forecasts aid in process automation, decision-making, and the extraction of insightful information from unprocessed data.
Common Classification Algorithms in Data Science
1. Logistic Regression
Logistic regression predicts the probability that a particular input falls into a particular category, such as true/false, spam/not spam, or yes/no.
It is easily comprehensible, interpretable, and simple to apply. It is surprisingly powerful for many jobs, and even beginners can immediately grasp how input features influence predictions.
Predicting a sales lead's likelihood of becoming a customer is a typical application that aids companies in more efficient resource allocation and follow-up prioritization.
2. Decision Trees
Decision trees provide the model with a clear, linear path from root to leaf by splitting data into branches according to feature values.
They are visual and intuitive, making decision-making simple to comprehend. Additionally, this clarity helps in explaining results to stakeholders who are not technical.
Identifying high-risk loan applicants is a frequent application that enables banks to issue safer loans while reducing the likelihood of defaults and losses.
3. Random Forests
Multiple decision trees are combined by random forests to provide predictions. They generate predictions that are more consistent and accurate than those made by a single tree by combining the output of several trees.
By reducing errors and overfitting that are typical of a single decision tree, this method improves performance and reliability across a variety of complicated datasets.
In order to effectively detect illnesses and assist physicians in making decisions, random forests are frequently employed in the medical field.
4. Support Vector Machines (SVM)
SVM determines the best line or hyperplane that divides several data categories, guaranteeing distinct boundaries for precise categorization of fresh observations.
For complicated issues with small-to-medium datasets, it works incredibly well. Proper data preparation guarantees that the model operates at its best and recognizes trends.
Classifying emails as spam or not is a typical use case that helps automate filtering and boost email management system productivity.
5. k-Nearest Neighbors (k-NN)
Using distance measures, k-NN compares a new data point with the most similar points in the dataset to predict its category.
The algorithm is straightforward, easy to understand, and involves few presumptions. For beginners, its simple methodology makes it simple to apply and comprehend.
Recommendation systems that make movie or product recommendations to users based on the tastes of comparable customers frequently employ k-NN.
6. Naive Bayes
Even with big datasets, Naive Bayes makes predictions fast and effectively by classifying data points into categories using probability and prior knowledge.
Because of probabilistic reasoning, it is quick, manages big datasets efficiently, and excels at text-based tasks like document classification or emails.
Naive Bayes is frequently used to classify news items by topic or filter spam emails, which helps automate processes and speed up decision-making.
Step-by-Step Example (Hands-On)
Step 1: Data Preparation
Gather emails that have been classified as spam or not, clean the text, eliminate irrelevant phrases, and arrange the dataset for precise analysis.
Step 2: Model Selection
For beginners and small-to-medium-sized datasets, pick an easy-to-understand model like logistic regression or decision trees.
Step 3: Training
Give the model the cleaned and prepared data so it can reliably identify patterns and relationships in the training dataset.
Step 4: Evaluation
To effectively increase prediction performance, test the model with unseen data, verify accuracy, precision, and recall, and modify the parameters.
Step 5: Interpretation
To better understand the behavior of the model and make better decisions, examine which words or attributes are most important for predicting spam.
Step 6: Deployment
Use the trained model to automatically categorize fresh emails, which will improve overall email management efficiency, streamline workflow, and save time.
How to Evaluate Classification Models
If you don't know how well an algorithm works, even the best one is worthless. Here is an explanation of evaluation metrics that is suitable for beginners:
-
Accuracy: The percentage of accurate forecasts among all forecasts is known as accuracy. It's straightforward, but with unbalanced datasets, it can be deceptive.
-
Precision: Precision determines the proportion of projected positive cases that were true, demonstrating the model's efficacy in preventing false positives.
-
Recall: Recall measures the number of real positive cases that were accurately identified, indicating the model's capacity to find all pertinent cases.
-
F1-Score: F1-Score balances precision and recall into a single score to give a more complete picture of model performance.
-
Confusion Matrix: A visual table that contrasts expected and actual classes to assist pinpoint particular kinds of prediction errors is called a confusion matrix.
Common Challenges in Classification
-
Imbalanced Datasets: Models may become biased and fail to correctly detect instances of minority classes when one class dominates in the dataset, predicting majority classes more frequently.
-
Overfitting: On training data, a model may work perfectly, but on fresh data, it may learn noise rather than the dataset's generalizable patterns.
-
Underfitting: A model that is overly simplistic is unable to identify significant patterns, which leads to wrong projections and low accuracy in all classes.
-
Feature Selection: The model can become confused by selecting the incorrect features or adding unnecessary ones, which lowers accuracy and makes it more difficult to interpret the findings.
-
Noisy Data: The model may be misled by mistakes, inconsistencies, or missing values in the dataset, which would reduce performance and reduce the accuracy of predictions.
-
Choosing the Right Algorithm: Particularly for real-world applications, choosing a technique that is incorrect for the quantity, complexity, or kind of the dataset might limit accuracy and overall effectiveness.
Real-World Applications of Classification in Data Science
Classification is everywhere in data science applications. Here are some common examples:
-
Email Spam Detection: By keeping inboxes effectively structured, classification saves time and increases productivity by automatically identifying and screening junk emails.
-
Image Recognition: It powers applications like automated tagging and facial recognition by enabling algorithms to categorize objects or persons in pictures.
-
Customer Segmentation: Customers are categorized by businesses according to their interests or behavior, which allows for customized experiences and targeted marketing.
-
Medical Diagnosis: Classification models let doctors make quicker, more accurate medical decisions by predicting diseases from patient data.
-
Fraud Detection: Financial organizations identify fake transactions by identifying trends in data, lowering risk, and successfully safeguarding clients' assets.
-
Autonomous Vehicles: Real-time object, pedestrian, and traffic sign classification allows self-driving cars to make informed decisions and navigate safely.
Developing proficiency in classification in data science allows you to turn unprocessed data into understandable insights that lead to more intelligent choices. You can handle real-world issues more quickly and effectively if you know how to arrange, forecast, and assess data. These abilities enable you to make significant, practical decisions, from identifying spam emails to forecasting consumer behavior or health outcomes. At first, the path could seem intimidating, but with practice, algorithm experimentation, and learning from mistakes, you'll acquire confidence. Start using these strategies right now, and you'll see how even modest classification improvements may have an enormous impact on your work and projects.