


Difference Between Data Science and Business Intelligence
Discover the difference between data science and business intelligence, their tools and purposes, and how they help businesses make smarter decisions and grow.
Every day, we are surrounded by data. Our actions generate a vast amount of information, whether we are shopping online, using social media, or managing our banking apps. Companies must navigate this growing influx of data and information. However, raw data alone is not enough. To help teams make informed decisions daily, it must be transformed into valuable insights.
Businesses frequently use two methods to understand all this data: data science and business intelligence. Both use data to inform choices, but their approaches and areas of concentration differ. Anybody interested in learning more about this area can benefit from taking a data science course, which can teach them how to recognize trends, predict outcomes, and use data to make more effective company choices.
What is Data Science?
Data science is the practice of looking at data to identify trends and valuable insights. It assists companies and organizations in better understanding their data, solving issues, and making more informed decisions. It turns raw data into helpful information by combining facts, figures, and tools.
Data scientists use various methods to analyze data, identify patterns, and predict outcomes. It's crucial to understand the story behind the facts, not just focus on the numbers. By doing so, businesses can make decisions that drive growth and success, improve services, and plan more effectively.


Understanding the Key Components of Data Science
-
Data Collection: Collecting data from a variety of sources, including online activity, sales records, and customer reviews. This stage guarantees that you have the correct information for analysis and decision-making.
-
Data Cleaning: Eliminating from the data that has been gathered mistakes, duplication, and unnecessary information. Because it increases accuracy and builds team trust in the analysis's findings, clean data is vital.
-
Data Analysis: Searching for correlations, trends, and patterns in the cleansed data. Data science may help with this by transforming numbers into insightful information that can be used to make decisions.
-
Data Visualization: Utilizing dashboards, graphs, or charts to display data. Teams find it easier to evaluate data, see trends, and reach swift, well-informed choices when they use visual aids.
-
Predictive Modeling: Making predictions about the future based on historical facts. This aids businesses in making plans, avoiding hazards, and acting in ways that can boost productivity and growth.
-
Reporting & Decision Making: To help teams and supervisors make informed decisions, insights are shared in straightforward reports. Good reporting guarantees that data produces useful, tangible outcomes for the company.
Exploring the Core Objectives of Data Science
-
Understanding Trends: Analyze data from the past and present to find trends. Businesses can enhance their plans, make smarter judgments, and react more effectively to shifts in customer behavior or market conditions by identifying trends.
-
Problem Solving: Data can be used to solve business problems. Teams can identify the underlying causes of problems and take steps to enhance performance and outcomes by closely analyzing data.
-
Decision Support: Give teams and managers concrete insights to help them. Effective planning for both short- and long-term objectives is facilitated by data-driven decisions, which are more accurate and dependable.
-
Predicting Outcomes: Utilize historical data to predict future outcomes. This helps companies in anticipating shifts, preparing for potential hazards, and taking proactive measures to maintain market competitiveness.
-
Optimizing Processes: Examine processes and operations to identify areas where you may improve productivity. By using data, businesses may save time, save waste, and increase overall quality and production.
-
Enhancing Customer Experience: To enhance services, learn about consumer preferences, behavior, and feedback. Data enables companies to improve customer happiness, create more enduring relationships with customers, and deliver better experiences.
Key Tools and Technologies Used in Data Science
-
Python: One of the most flexible programming languages for data projects. It is one of the most important tools in use today since it facilitates analysis, model construction, and visual presentation.
-
R: The language was developed for research and statistics. It is strong for data analysis, model testing, and producing eye-catching charts that aid in clearly communicating findings.
-
SQL: A database administration and query tool. It makes it easier to understand organized business data by enabling users to gather, filter, and arrange huge amounts of information.
-
Tableau: A visualization software that creates simple dashboards and visualizations from data. Decision-makers may swiftly comprehend figures, trends, and patterns with its assistance without the need for complex technical knowledge or code.
-
Power BI: An application from Microsoft for creating reports and dashboards. With its numerous data sources, it enables teams to exchange insights and make more informed business decisions.
-
TensorFlow: A framework made for activities using machine learning. With its ability to train models, identify patterns, and forecast results, it supports sophisticated applications in contemporary data-focused projects and research.
What is Business Intelligence?
The process of transforming corporate data into information that is helpful is known as business intelligence. It helps companies in comprehending both the past and the present. Teams may swiftly assess performance and make better decisions by utilizing dashboards, reports, and charts.
The primary objective of business intelligence is to help with improved decision-making. Instead of predicting the future, it concentrates on evaluating data from the past and present. Clear insights enable managers and staff to monitor developments, spot issues, and take appropriate action to enhance business outcomes.
Understanding the Key Components of Business Intelligence
-
Data Sources: Financial records, client feedback, and sales systems are just a few of the sources of data that business intelligence gathers. The basis for producing trustworthy reports and insightful information is provided by these sources.
-
Data Warehousing: An information gathering system that collects data from many sources. Teams can access, evaluate, and comprehend the information more easily because it is centralized.
-
Data Integration: Integrates data from several systems into a single view. By employing this procedure, companies are guaranteed to see the big picture rather than disparate, unclear bits of data.
-
Data Analysis: Information analysis to identify patterns and trends. Analysis enables teams to comprehend what is going on in the company, why it is happening, and where changes could be required.
-
Reporting: Drafting simple reports that provide an overview of company operations. Reports give managers and employees lucid data that they can utilize for daily decision-making, planning, and problem-solving.
-
Dashboards: Visual representations of critical performance metrics. Dashboards make it simple for teams to track progress and take prompt, well-informed action by presenting data in charts and graphs.


Exploring the Core Objectives of Business Intelligence
-
Tracking Performance: Businesses may track sales, revenue, and other important metrics with the aid of business intelligence. Monitoring these figures guarantees that companies are aware of their development and are able to react swiftly to any changes.
-
Improving Decisions: Business intelligence facilitates better decision-making by transforming data into insights. Managers get the knowledge necessary to make wise decisions and confidently lead their teams.
-
Identifying Problems: Weak areas in business operations are highlighted by business intelligence. Early problem detection enables businesses to make necessary corrections before minor issues escalate into major difficulties.
-
Saving Time: Manual labor is decreased via automated dashboards and reports. Teams may swiftly access pre-made insights rather than manually compiling numbers, demonstrating the actual power of data in routine business operations.
-
Boosting Efficiency: Business intelligence demonstrates the utilization of resources. Businesses may eliminate waste, enhance workflows, and improve the efficiency of daily operations by researching this data.
-
Supporting Growth: Business intelligence insights assist companies in understanding client demands, identifying opportunities, and making plans. This advice enables businesses to grow with assurance and accomplish long-term objectives.
Key Tools and Technologies Used in Business Intelligence
-
Tableau: A well-liked tool for making dashboards and visualizations. It facilitates users' ability to swiftly transform business data into visualizations, which facilitates trend analysis, insight sharing, and decision-making.
-
Power BI: An application from Microsoft that has connections to numerous data sources. Businesses can quickly share real-time information across many teams, monitor performance, and create interactive reports with it.
-
QlikView: Self-service analysis is supported by the platform. Without constantly requiring technical experts, it enables users to independently examine data, find hidden patterns, and make conclusions.
-
SAP BusinessObjects: A group of tools for analysis and reporting. It assists companies in monitoring activities, creating insightful reports, and providing managers with accurate data for planning.
-
MicroStrategy: A platform with strong reporting capabilities for corporate intelligence. Through dashboards, analytics, and mobile access, it enables businesses to examine performance and make more informed decisions.
-
Looker: A tool for businesses to share and study data. It produces lucid visualizations, interacts with cloud databases, and facilitates improved departmental cooperation through shared insights.
Key Differences Between Data Science and Business Intelligence
1. Purpose
-
Data Science: Finding hidden patterns and forecasting future events are its primary objectives. It helps businesses plan for the future with confidence and creativity by looking beyond present performance and utilizing models and data to answer "what might happen next."
-
Business Intelligence: Its primary objective is to explain current and historical outcomes. It assists managers in making daily or monthly choices by illustrating "what happened." It helps companies monitor performance and modify strategies as necessary by emphasizing precision and clarity over forecasting.
2. Type of Data
-
Data Science: Works with both organized and unstructured data, such as numbers, text, photos, and videos. It handles massive and intricate datasets, looking for profound insights that support companies in predicting patterns, analyzing consumer behavior, and investigating options beyond straightforward reporting or summaries.
-
Business Intelligence: Primarily uses structured data, like inventory counts, sales records, and customer information. Managers and employees may quickly and easily comprehend performance thanks to the way it arranges and processes this data into reports, dashboards, and infographics that clearly explain business activity.
3. Techniques Used
-
Data Science: The first approach utilizes advanced techniques such as programming, machine learning, and statistical modeling. By employing these methods, experts can test hypotheses, create predictive models, and uncover relationships within the data that may not be apparent through basic reporting techniques.
-
Business Intelligence: In contrast, the second approach relies on simpler methods, including data summarization, reporting, and visualization. Its objective is to make current data more accessible for daily decision-making by presenting it in a format that managers can easily understand, without requiring extensive models or advanced programming knowledge.
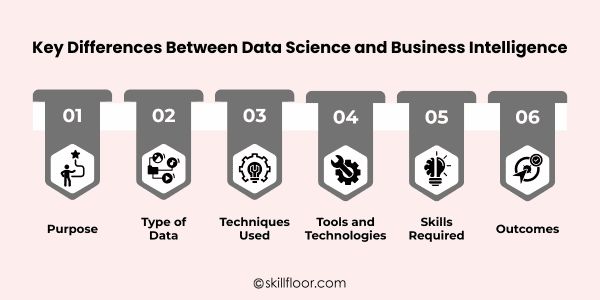
4. Tools and Technologies
-
Data Science: Frequently makes use of R, Python, and machine learning frameworks such as TensorFlow. These technologies support data analysis, algorithm development, and outcome-predictive model creation, which makes them effective for long-term business planning and innovation.
-
Business Intelligence: Using programs such as QlikView, Power BI, and Tableau. These tools transform unprocessed data into readable dashboards and reports. They provide managers with a clear visual representation of trends and performance, allowing them to communicate insights with teams and make choices.
5. Skills Required
-
Data Science: Requires an in-depth understanding of programming, statistics, and mathematics. Data scientists are required to create predictive models, write code, and clean data. They find significant insights that can effectively inform major business decisions by fusing technical expertise with problem-solving skills.
-
Business Intelligence: Demands proficiency with databases, reporting, and data visualization. Advanced coding skills are not necessary for professionals in this field. Their goal is to create dashboards and reports that are easy to read, understand, and helpful so that executives can rapidly grasp the significance of the data.
6. Outcomes
-
Data Science: Generates predicted information that directs future tactics. It assists companies in improving operations, finding new opportunities, and anticipating hazards. Looking ahead, the results frequently encourage expansion, creativity, and proactive choices that create long-term success in cutthroat marketplaces.
-
Business Intelligence: Generates visual insights to explain current and historical business performance. Clear dashboards, reports, and trend analysis are among the results. Without putting too much emphasis on the future, these findings assist leaders in monitoring objectives, comprehending progress, and making trustworthy selections to enhance current operations.
Choosing the Right Approach: Data Science vs. Business Intelligence
|
Aspect |
Data Science |
Business Intelligence |
|
Goal |
Focuses on creating future strategies through predictions and experiments with data. |
Focuses on monitoring current operations through detailed reports and performance tracking. |
|
Nature |
Exploratory in nature, often testing new ideas to discover hidden opportunities. |
Descriptive in nature, explaining what has already happened within the business. |
|
Complexity |
Involves advanced algorithms and coding, requiring deeper technical understanding. |
Involves straightforward reporting tools, requiring less technical knowledge to operate effectively. |
|
Innovation |
Encourages innovation by identifying new business opportunities using predictive models. |
Encourages stability by ensuring existing processes run smoothly and efficiently with data. |
|
Audience |
Mostly used by analysts, researchers, and strategists for long-term planning. |
Mostly used by managers, executives, and employees for everyday business decisions. |
|
Speed |
May take longer because of modeling and testing data accuracy. |
Provides faster results through ready-made dashboards and visual summaries. |
Future Trends in Data Science and Business Intelligence
As business intelligence and data science continue to evolve together, the future looks promising. Businesses will increasingly rely on predictive analytics, real-time data, and advanced technologies to simplify decision-making. Cloud platforms and automation will play a vital role in enhancing data accessibility. Together, these trends will help companies improve their understanding of consumers, boost performance, and make informed decisions for sustained growth.
Businesses may better comprehend and utilize their data with the aid of data science and business intelligence. Business intelligence enables teams to effectively see what has already occurred and make prompt, well-informed decisions, whereas data science concentrates on forecasting the future and identifying hidden trends. When combined, the two strategies offer businesses a comprehensive understanding of their operations and opportunities. Gaining proficiency with the appropriate tools, conducting thorough information analysis, and communicating insights in an easy-to-understand manner can have a significant impact. Businesses may increase productivity, gain a deeper understanding of their clients, and make more confident judgments by adopting these strategies, which will result in sustainable growth and success in the fast-paced world of today.