


The Role of Hypothesis Testing in Data Science
Discover how hypothesis testing helps data scientists make data-driven decisions by validating assumptions and analyzing patterns in real-world datasets.

Did you know that not every data pattern indicates a significant finding? A sudden change can occasionally be related to chance. Hypothesis testing has significance because of this. It assists you in determining if the data you see is accurate or merely coincidental. By taking one easy step, you may avoid making bad judgments based on incorrect signals and save time and money.
People all throughout the world utilize hypothesis testing to help them make better decisions. It is used by doctors to test new treatments. It is used by online retailers to enhance their websites. Even well-known companies like Google and Amazon test concepts before implementing them. It enables people to ensure that their choices are supported by actual, beneficial outcomes.
It's acceptable to have doubts regarding data. We may easily verify before action by using hypothesis testing. Anyone who wants to make fair, effective choices and steer clear of errors based on hurried or imprecise data should use it; it's not just for professionals.
What is Hypothesis Testing?
The purpose of hypothesis testing is to determine if an observation you make about data is genuine or the result of pure chance. It assists you in seeking evidence and posing the appropriate query. This strategy helps you determine whether your concept or change makes a difference, rather than relying on conjecture.


For example, people do hypothesis testing to determine whether a new advertisement is more effective or whether a new medication is more beneficial than an old one. Instead of relying just on sentiments, it provides a quantitative response. Your judgments become safer, more robust, and simpler to defend to others as a result.
Understanding the Importance of Hypothesis Testing in Data Science
-
Checks If Patterns Are Real: Data science can be deceived by trends. With hypothesis testing, you may determine if a pattern is genuine or merely coincidental before making a significant choice.
-
Supports Better Business Choices: Data science teams employ hypothesis testing to inform feature, price, and product adjustments. Better business decisions result from the solid evidence it provides rather than conjecture.
-
Makes Experiments Trustworthy: Doing A/B testing or other tests? To determine whether the new version actually performs better, hypothesis testing is helpful. As a result, your data science experiments remain trustworthy and equitable.
-
Avoids Costly Mistakes: Using preliminary data to draw conclusions can be costly. To prevent waste and incorrect turns, hypothesis testing lets data science teams take their time and verify results before acting.
-
Builds Team Confidence: Data science teams find it easier to explain outcomes when decisions are supported by hypothesis testing. It fosters confidence among managers, clients, and data specialists.
-
Works in Every Industry: Data science employs hypothesis testing to determine what actually works in a variety of industries, including healthcare, retail, and education. No matter where and how it is utilized, it is a useful tool.
Key Terms of Hypothesis Testing
-
Null Hypothesis: According to the null hypothesis, nothing has changed. It is where the testing process begins. In data science, it assists in determining if a novel concept actually improves things.
-
Alternative Hypothesis: This is the null's opposite. It implies that a change or impact is actually occurring. It supports the notion that something new may be superior in testing.
-
P-value: The likelihood that your outcome was the result of chance is indicated by a p-value. A modest p-value indicates a strong discovery that may not be a coincidental surprise.
-
Significance Level (α): Usually set at 0.05, this cut-off value aids in determining whether your findings are significant. It gives you some confidence in deciding whether to accept or reject your notion.
-
Test Statistic: A test statistic is a figure derived from your data that indicates the degree to which your outcome deviates from expectations. It helps in the simple comparison of concepts in the role of data science.
-
Confidence Interval: A confidence interval provides a safe range that most likely contains the correct answer. It gives outcomes context and helps you determine how confident you may be in your conclusions.
Types of Hypothesis Testing
-
One-Tailed Test: A one-tailed test searches for a change in one particular direction, such as a rise or fall. When you clearly anticipate outcomes to progress in one direction only—not both—it's useful.
-
Two-Tailed Test: A test with two tails looks for any shift, whether it's upward or downward. When you're unsure of which path to anticipate and want to remain open to both, it might be helpful.
-
Z-Test: If the standard deviation is known and you have a lot of data, you utilize a z-test. It assists in determining whether the results of your sample exceed expectations.
-
T-Test: For datasets that are smaller, a t-test is useful. It analyzes two groups, such as before-and-after findings, to determine if the observed differences are genuine or the product of chance.
-
Chi-Square Test: Product options and age groupings are two examples of categories that may be compared using the chi-square test. It indicates if two items are connected or whether their relationship is purely coincidental.
-
ANOVA (Analysis of Variance): When comparing three or more groups simultaneously, ANOVA is utilized. It makes it simpler to comprehend the overall effect or change by indicating whether at least one group is different.
Understanding Type I and Type II Errors in Hypothesis Testing
1. Type I Error (False Positive)
A Type I error happens when you think something has changed, but it really hasn’t. You reject the truth by mistake.
Example: You believe a new medicine works better, but it doesn’t. The test result says “yes,” but in reality, nothing is different—it’s a false alarm.
2. Type II Error (False Negative)
A Type II error happens when you miss a real change. You think there’s no effect, but there actually is one.
Example: You test a new teaching method and see no improvement, so you ignore it—but the method truly helps, and you just didn’t notice it in the data.
When to Use Hypothesis Testing in Your Data Science Workflow
-
Before Launching a New Feature: Test hypotheses in advance of implementing a new feature. It helps verify if the change would enhance the user experience, lowering the possibility of subpar outcomes based on intuition.

-
When Comparing Two User Groups: Hypothesis testing helps in determining if behavioral variations between two groups—such as free and paid users—are genuine or the result of chance, which supports more informed business choices.
-
During A/B Testing: Hypothesis testing is used in A/B tests to determine which version performs better. It guarantees decisions are informed by solid data rather than conjecture or hasty enthusiasm about marginal outcomes.
-
Validating a Data Trend: Testing hypotheses helps confirm trends that appear in your charts. Your data science workflow gains a milestone, which strengthens and validates it.
-
Evaluating Marketing Impact: launched a fresh campaign? To determine whether sales actually got higher, use hypothesis testing. It guarantees that decisions are founded on outcomes rather than sentiments and holds marketing teams accountable.
-
Testing Model Improvements: Check to see if the updated model actually performs better. Testing hypotheses gives improvements more credibility and keeps teams focused on what is truly getting better.


A Step-by-Step Guide to Hypothesis Testing in Data Science
1. Define Hypotheses
Tests of hypotheses compare two hypotheses: one that claims nothing changes and another that claims something happens. This makes testing hypotheses fair and transparent.
-
Null Hypothesis (H₀): According to the null hypothesis, nothing changes or has an impact. We begin with this default hypothesis and only reject it when the data provides compelling evidence.
-
Alternative Hypothesis (H₁): There is an actual impact or difference, according to the alternative hypothesis. We adopt this theory rather than the null if the data provides compelling evidence.
2. Choose a Significance Level
Selecting a significance level entails determining the amount of risk you are prepared to accept if you are mistaken. The most common value is 0.05, meaning a 5% possibility of mistake. It assists you in determining whether your results are reliable enough to act upon.
3. Collect and Analyze data
One of the most crucial stages in testing your idea is collecting and analyzing data. First, make sure you have adequate data from your source or experiment. After that, arrange everything and search for trends. This offers you a clear picture of the situation and a strong foundation on which to make just judgments. Many students learn this in a data science course as part of real-world problem-solving.
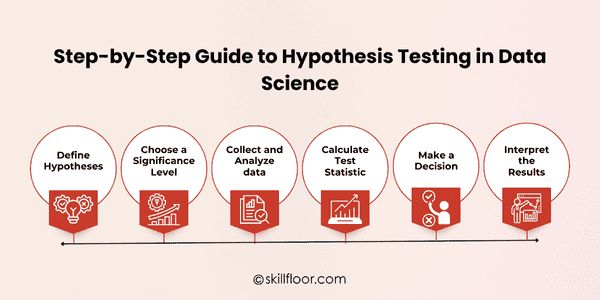
4. Calculate Test Statistic
Converting your data into a number that shows how much your outcome deviates from your expectations is known as the test statistic calculation. You can use this figure to determine if the change you observe is genuine or merely coincidental. Various tests employ various formulae depending on the size and kind of your data.
5. Make a Decision
After gathering your data and determining your p-value, it's time to make a definitive choice.
The probability that your test results would be seen if the null hypothesis (H₀) were true is indicated by the p-value. Put simply, it determines whether or not the results of your random chance investigation are surprising.
This p-value should now be compared to your significance threshold, which is often set at 0.05:
-
If the p-value is less than 0.05: This indicates that the impact you saw is most likely real and that your outcome is unlikely to have happened by accident. Thus, you accept the alternative hypothesis (H₁) and reject the null hypothesis.
-
If the p-value is greater than 0.05: This means that chance might readily account for your outcome. The null hypothesis is thus not successfully rejected.
6. Interpret the Results
Understanding what your choice tells you is necessary for interpreting the outcomes. Your concept probably works if you rejected the null hypothesis. If not, it indicates that the evidence is still insufficient. Before making any final judgments, always take the context, the quality of the evidence, and the practical implications into account.
Best Practices for Using Hypothesis Testing in Data Science
-
Start With a Clear Question: Start with a simple, targeted query. This prevents misunderstandings later on and maintains your testing aim clear. There are more beneficial outcomes and more informed choices when the question is clearly stated.
-
Use the Right Test for Your Data: Pick the test that best suits the size and kind of your data. Even if your data is clean and correct, using incorrect data might result in mistakes or misleading results.
-
Keep the Sample Size Fair: Weak responses might result from insufficient data. Make sure there are enough variations in your sample to be meaningful. Your results remain robust and more reliable when the sample is balanced.
-
Control for Bias and Randomness: Verify data collection methods at all times. Outcomes may be impacted by bias or unequal groupings. A complete image free of erroneous patterns or deceptive conclusions is made possible by clean, honest data.
-
Highlight the Real Meaning: Focus on the Data Science Impact, or what the outcome implies for your team or company, in the middle of your results. Explain how it supports actual decisions rather than just the numbers.
-
Don’t Ignore Practical Value: Consider if this matters in real life, even if the results are statistically significant. To determine whether your finding is actually worth acting on, combine statistics with common sense.
Top Tools Every Data Scientist Should Use for Hypothesis Testing
-
Python (with SciPy or Stats models): Python provides user-friendly libraries for executing tests such as t-tests and z-tests. These tools are excellent for producing clear, reliable outcomes in daily work and simplify computations.
-
R Programming Language: R is an effective tool for testing and statistics. It is ideal for detailed analysis and comes with built-in tools for testing hypotheses, particularly when it comes to displaying data and test results.
-
Excel or Google Sheets: Spreadsheets come in useful for short tests. You can quickly arrange data and run t-tests thanks to built-in tools. Excellent for tiny projects or educating non-programmers about concepts.
-
JASP (Free Software): JASP is an easy-to-use program that provides findings in simple charts and tables. Beginners or groups that wish to test concepts without learning a programming language will find it ideal.
-
Minitab: Professionals should consider Minitab. It is frequently employed in sectors including manufacturing and healthcare. To test process enhancements, a quality control data scientist may utilize Minitab.
-
SPSS (IBM): Both the commercial and social science domains use SPSS extensively. It facilitates the execution of tests and provides clear feedback. A fantastic instrument for managing experimental data and surveys.
Common Mistakes and Misunderstandings in Hypothesis Testing
-
Confusing Correlation with Causation: It is not necessarily the case that one event produced the other just because two things occur together. Although hypothesis testing looks for trends, it cannot establish causation. Before making important judgments, always do more research.
-
Misreading the P-value: A low p-value just indicates that the result is unlikely to be the product of chance, not that your hypothesis is right. It's not a definitive response, just a hint. Context and data quality should always be taken into account.
-
Testing Without a Clear Question: Confusion results from launching into testing without a defined objective. Before you begin, you must have a clear idea of what you want to find; otherwise, the findings will not be helpful.
-
Using the Wrong Test Type: Tests must be tailored to the specific query. Not all circumstances call for the use of a t-test. Even with solid and clean data, the improper test might provide incorrect findings.
-
Ignoring Sample Size: While too much data might make little changes appear significant, too little data can conceal the reality. Your test will produce fair and honest findings if you use the appropriate quantity of data.
-
Forgetting Real-World Meaning: Even if a finding is "statistically significant," it may still be useless. Consider if it matters in real life, even if your stats indicate that anything changed. Don't overlook the practical implications.
Hypothesis testing is like a trusted guide in the world of data science. It encourages you to take your time, ask the correct questions, and base your decisions on facts rather than conjecture. This approach keeps your choices transparent and honest, whether you're testing a concept, introducing a new feature, or comparing outcomes. Anyone who wishes to utilize data wisely and responsibly may use it; it's not only for professionals. Making this extra effort may save time, prevent errors, and increase the confidence of every data-driven choice, whether it is for minor initiatives or major company decisions. Smarter results might come from little checks.