


A Beginner’s Guide to the Data Science Workflow
Learn the key steps in the data science workflow, from data collection to model deployment, tailored for beginners.

Do you frequently wonder what to do with statistics that you see in reports or apps? It's a common sentiment. Data is present in many aspects of our lives, including our phones, companies, and daily activities. However, the value of data is contingent upon our ability to interpret and utilize it. You may transform confusing data into understandable, practical insights by mastering the fundamentals, such as posing pertinent queries and identifying basic trends.
Many people begin studying facts but become confused in the absence of clear instructions. Learning can be helped by an approachable curriculum based on actual cases. Fear and confusion are reduced when every aspect has been explained clearly. Knowing what to do and why it matters gives you the courage to study and transform facts into something useful.
What is Data Science?
The use of facts and figures to arrive at conclusions is known as data science. It facilitates pattern recognition, problem solving, and improved decision making. Data science transforms raw information into something valuable that can direct intelligent activities, from monitoring sales to examining health patterns.
It's not only for specialists; everybody may use it. Anyone can get started with a few simple steps, such as asking the proper question, gathering the correct data, and comprehending the results. Data science enables everyone to understand what the numbers are telling, whether they are students, entrepreneurs, or simply inquisitive.


The Impact of Data Science on Today’s World
-
Better Healthcare Decisions: Doctors may improve patient care by using data science to identify trends in patient information. By transforming medical data into practical, understandable insights, it facilitates quicker diagnosis and treatment approaches.
-
Smarter Business Choices: Companies employ data science to comprehend consumer behavior. By making informed judgments based on data, they are able to predict trends, provide better services, and increase customer happiness.
-
Improved Student Learning: Education is expanding the role of data science. Schools may monitor student achievement and modify their teaching strategies to make learning more efficient and tailored to each student.
-
Winning in Sports: Data science is being applied in sports to decrease injuries and enhance performance. To make more informed decisions about game time, teams look at player statistics and training schedules.
-
Helpful Farming Insights: Data is used by farmers to assess crop health, weather, and soil conditions. This helps farmers plan more effectively, which improves food quality, decreases waste, and boosts farming efficiency.
-
Smarter City Planning: Data science is used by governments for resource management, transportation optimization, and city planning. It assists leaders in making just and wise choices that have a more positive impact on people's daily lives.
The Importance of a Structured Data Science Workflow
-
Clear Starting Point: Starting with the correct inquiry is made easier with an organized procedure. This helps you stay on task and prevents you from wasting time on irrelevant information.
-
Organized Steps: Your job remains organized and manageable if you adhere to a specific procedure. You never become overwhelmed or trapped because you always know what to do next.
-
Better Data Handling: When you adhere to a procedure, your data is appropriately cleaned and arranged. This facilitates comprehension and helps you steer clear of errors in your final output.
-
Stronger Insights: You may explore the data with the use of step-by-step procedures. Rather than speculating or drawing hasty assumptions, you identify significant patterns and discover practical solutions.
-
Simple Communication: You may explore the data with the use of step-by-step procedures. Rather than speculating or drawing hasty assumptions, you identify significant patterns and discover the power of data through practical solutions.
-
Confidence in Results: You can trust your results if you take your time with each stage. When your process is obvious, you can be sure that your work is sound and that your conclusions are supported by evidence.
Overview of the Data Science Workflow
The data science workflow is a methodical process that assists in converting unusable data into insightful conclusions. A simple inquiry is often asked first, and then the appropriate data is gathered and cleaned. The next step is to examine the data, look for trends, and make inferences. Every step in the process builds on the one before it, keeping you on task and preventing you from becoming bogged down in the minutiae.
Clear instructions and practice make learning this procedure simpler. This procedure is frequently taught from beginning to end in a quality data science course, including real-world applications. The task becomes more efficient and significant when the steps are followed in the correct order. Whether you're working on a school assignment or a corporate challenge, this framework helps you improve your outcomes and develop your talents over time.
A Step-by-Step Guide to the Data Science Workflow
1. Understanding the Problem
Before working with data, you must understand the problem you are trying to solve. This entails having a conversation with the stakeholders, customer, or team and posing straightforward queries such as:
-
What decision are we trying to make?
-
What are we trying to improve or fix?
For example, finding out which goods sell the best or the reasons behind declining sales may be the aim of a shop looking to boost sales. Additionally, you specify what constitutes success, such as a 10% rise in monthly sales.
2. Data Collection
The next step after defining your goal is to collect evidence that supports it. Depending on your objectives, you can get data via surveys, public files, databases, websites, and technologies like APIs.
-
Online tools (APIs)
-
Company databases
-
Public datasets
-
Web scraping (with permission)
Verify that you have permission to use the data, particularly if it contains personal information. To remain safe and courteous, always handle data effectively, follow privacy regulations, and give credit when necessary.


3. Data Cleaning & Preprocessing
Most data aren't perfect. It could include mistakes, odd forms, or missing values. You may resolve these problems and get the data ready for improved use and comprehension by using useful data cleaning tools.
-
Filling or removing missing data
-
Fixing outliers (unusual numbers that don’t fit)
-
Converting data into the right formats (like dates or numbers)
-
Standardizing values (so everything is on the same scale)
Accurate findings are made easier by clean data. The most powerful models will perform poorly if the data is disorganized. Early issue solving results in wiser, more reliable insights and saves time later.
4. Exploratory Data Analysis (EDA)
Data exploration is similar to looking through a photo album. You search for patterns, unexpected events, or anything that catches your attention. You can plainly understand the overall picture with the aid of charts, graphs, and summaries.
-
Averages and totals
-
Charts and graphs (like histograms or scatter plots)
-
Correlation maps to see how things relate
EDA facilitates the identification of linkages and patterns in the data. It helps you focus on the appropriate things by highlighting what's crucial and what could be lacking, directing how to proceed.
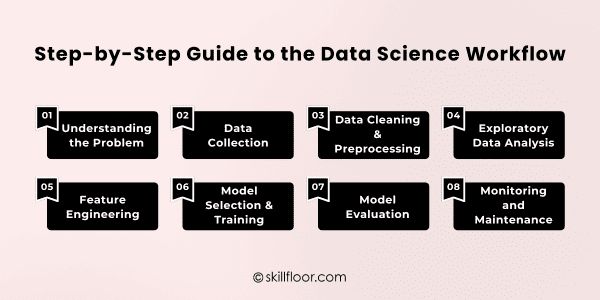
5. Feature Engineering
Using what you've learned, you prepare the data for better usage in this stage. By data science principles, you may modify the way values are organized for improved comprehension, add new features, or eliminate ones that aren't needed.
-
Creating new columns (e.g., “month” from a full date)
-
Removing columns that aren’t useful
-
Turning text or categories into numbers
-
Reducing complexity by combining similar features
Using feature engineering allows your model to concentrate on what's essential. The model may learn more quickly and provide more intelligent predictions if it receives specific, well-shaped data, which frequently results in significantly improved performance all around.
6. Model Selection & Training
It is now time to construct your model. Start by selecting the kind that best suits your objective, such as category or number prediction. The question you are attempting to answer with your data will determine which option is best.
-
Use regression for predicting numbers (like sales)
-
Use classification for predicting categories (like spam or not spam)
Next, divide your data into training and testing sets. The model attempts to generate predictions after identifying patterns in the training data. This demonstrates its potential effectiveness in practical settings.
7. Model Evaluation
It's time to evaluate your model's performance after it has been trained. Following data exploration, you may assess how well the predictions match actual results using metrics like accuracy, precision, and recall.
-
Accuracy: The accuracy of your model indicates how frequently it is accurate. Though not always sufficient, it's a decent place to start, particularly if your data is uneven or contains more than two outcomes.
-
Precision & Recall: Precision indicates the proportion of reliable favorable forecasts made by your model. Recall shows the number of true positives it discovered. When combined, they provide you with insight into how effectively your model identifies essential factors.
-
Confusion Matrix: A confusion matrix illustrates your model's strengths and weaknesses. It helps you identify trends in errors and overlooked situations by dissecting accurate and inaccurate estimates.
Different problems require different metrics. Choose one that aligns with the company's objective rather than merely the highest number. Thorough testing guarantees your model produces practical responses rather than simply striking outcomes.
8. Monitoring and Maintenance
Over time, even a well-trained model may lose accuracy. This occurs when data from the actual world, such as consumer behavior or market trends, shifts. Models must therefore undergo routine inspections to remain dependable and beneficial.
-
Keep an eye on how your model performs
-
Watch for data drift (when new data looks different from old data)
-
Update or retrain your model regularly
You must monitor performance, keep an eye out for data changes, and retrain your model as necessary. This stage keeps your solution correct, practical, and prepared for long-term real-world outcomes.
Best Practices for an Effective Data Science Workflow
-
Start with a Clear Question: Recognize the precise issue you are trying to solve. An unambiguous query aids in concentration and keeps your project on course right from the start.
-
Collect Only What You Need: Avoid collecting too much information. Concentrate on gathering the data that is most pertinent to your objective. This avoids misunderstanding later and saves time.
-
Clean Your Data Early: As quickly as feasible, correct mistakes, formatting, and missing values. Clean data greatly simplifies and improves the accuracy of analysis and modeling.
-
Explore Before You Build: Explore the data for a while before diving into models. This facilitates the discovery of patterns, improved questioning, and early issue avoidance in the Data Science Process.
-
Keep Models Simple First: Start with models that are simple to comprehend. They can be tested and explained more quickly. Later on in the process, you may always try more complex ones if necessary.
-
Document Each Step: Put your actions and motivations in writing. Having clear notes makes it simpler to explain your work, do it again later, or address issues as they arise.
Common Mistakes to Avoid in the Data Science Workflow
-
Skipping the Problem Step: Confusion happens when tools are used hastily without fully comprehending the issue. In order to keep your work focused and purposeful right from the start, always begin with an easy question.
-
Collecting Too Much Data: Not all the time is better. Having too much data might cause noise and slow you down. Give your inquiry or project your full attention.
-
Not Cleaning the Data: Bad outcomes come from messy data. Duplicate rows, incorrect formats, or missing information might cause your entire project to go awry. You keep on course if you clean early.
-
Ignoring Basic Concepts: It might be more difficult later if you skip the data science foundations. Before experimenting with sophisticated tools or models, learn fundamental concepts such as data types, patterns, and structure.
-
Using Complex Models Too Soon: Don't start with advanced models. Particularly when you're first starting, simple models are frequently more effective and simpler to test, comprehend, and explain.
-
Forgetting to Check Results: Don't assume your model is accurate. Always use the appropriate measurements to test and double-check your results. By doing this, poor judgments based on inaccurate forecasts are avoided.
Gaining proficiency in the data science process takes time, but making little, consistent progress is crucial. Anybody may start transforming statistics into insightful knowledge with the correct information, a straightforward procedure, and a well-defined query. The true power is knowing what you're doing and why it's essential. Whether you're working on a project, addressing a business challenge, or simply researching out of curiosity, these abilities get better with practice. Remain interested, patient, and don't be scared to ask questions. One step at a time, genuine development starts when you learn something new from each endeavor.