


R Programming Interview Questions
Ace your next data science interview with the latest R programming interview questions and answers for 2025. Get expert insights, real-world scenarios, and up-to-date R concepts.

In 2025, R remains a vital tool in data science despite shifting trends in programming preferences. While Python leads, with approximately 90% of data professionals relying on it regularly, R continues to hold ground with around 38% usage, significant for a language more specialized in statistical computing. According to the TIOBE Index, R slid from 12th to 19th place in late 2022–2023 but still ranks as one of the top 20 programming languages worldwide.
Created in 1993, R excels in statistics, data visualization, and reproducible research, bolstered by over 21,000 packages in CRAN—especially the popular tidyverse ecosystem. Though Python dominates general-purpose data science, R remains indispensable for specialized tasks in academia, bioinformatics, and statistical modeling.
As data science roles continue to grow—projected at 16% growth by 2028—and global data generation approaches 97 zettabytes by 2025, expertise in R is still highly valued. Whether you're preparing for an interview or refining your skills, mastering R positions you as a proficient candidate in today's analytics-driven job market.
General R Programming Interview Questions and Answers
1. What is R, and why is it used in data science?


R is a programming language and software environment specifically designed for statistical computing and graphics. It’s widely used in data science for its vast library of packages (like dplyr, ggplot2, and caret), strong community support, and ability to handle complex data analysis and visualization tasks with ease. R allows analysts to perform exploratory data analysis, create reproducible research, and build predictive models efficiently.
2. How do you assign values to variables in R?
In R, you can assign values using either the <- operator or the = operator. For example:
x <- 10
y = 20
While both are accepted, <- is the preferred method in R programming as it maintains consistency with the language’s original syntax style.
3. What data types are supported in R?
R supports various data types including:
-
Numeric: decimal values (e.g., 3.14)
-
Integer: whole numbers (e.g., 5L)
-
Logical: TRUE or FALSE
-
Character: text strings (e.g., "Hello")
-
Complex: complex numbers (e.g., 1+4i)
-
Raw: raw bytes These can be combined into data structures such as vectors, matrices, lists, and data frames.
4. What are vectors in R?
A vector is the most basic data type in R. It is a sequence of data elements of the same basic type. You can create a vector using the c() function:
vec <- c(1, 2, 3, 4)
Vectors are fundamental for performing element-wise operations in R.
5. How do you handle missing values in R?
Missing values in R are represented by NA. Functions like is.na() help detect them. You can handle them using:
-
na.omit() to remove rows with NA values.
-
na.rm = TRUE in functions like mean() or sum().
-
Imputation using the mice or missForest packages.
6. What is a data frame in R?
A data frame is a table-like structure where each column can contain different types of data (numeric, character, factor). It is one of the most commonly used data structures for storing datasets. You can create a data frame using:
df <- data.frame(name = c("A", "B"), age = c(25, 30))


7. How can you import data into R?
You can import data using several functions:
-
read.csv() for CSV files
-
read.table() for tabular data
-
readxl::read_excel() for Excel files
-
jsonlite::fromJSON() for JSON
-
DBI::dbConnect() and dbReadTable() for databases
8. What is the difference between apply(), lapply(), and sapply()?
-
apply(): Used for matrices, applies a function over rows or columns.
-
lapply(): Applies a function to each element of a list, returns a list.
-
sapply(): Similar to lapply() but tries to simplify the result to a vector or matrix. Example:
x <- list(a = 1:5, b = 6:10)
sapply(x, mean)
9. How do you merge data frames in R?
Use the merge() function:
merged_df <- merge(df1, df2, by = "id")
You can also use dplyr functions like left_join(), right_join(), inner_join(), and full_join() for more flexibility.
10. What is factor in R?
A factor is used to represent categorical data. Factors store both the values and the corresponding levels:
factor_var <- factor(c("low", "medium", "high"))
They are useful for statistical modeling and grouping.
11. How do you create plots in R?
Base R offers functions like plot(), hist(), and boxplot(). Advanced plotting is often done with ggplot2:
library(ggplot2)
ggplot(data, aes(x = var1, y = var2)) + geom_point()
12. What is the use of tapply() in R?
tapply() applies a function to subsets of a vector grouped by a factor:
tapply(X = data$score, INDEX = data$group, FUN = mean)
Useful for group-wise aggregation.
13. Explain how memory management works in R.
R uses garbage collection to automatically manage memory. The gc() function can be called to trigger it manually. You should also remove unused objects using rm() and monitor memory usage with object.size().
14. What is the purpose of the attach() and detach() functions?
attach() allows accessing columns of a data frame as variables without using $. It can make code shorter but is discouraged in large projects due to the risk of confusion. Use with() instead for better practice.
15. How do you write functions in R?
Functions are defined using the function keyword:
my_function <- function(x, y) {
return(x + y)
}
Functions can also have default arguments and return multiple outputs using lists.
Intermediate R Programming Interview Questions and Answers
1. What is the difference between a list and a vector in R?
A vector is a simple data structure that contains elements of the same type (numeric, character, logical, etc.), whereas a list can contain elements of different types, including vectors, functions, and even other lists. Lists are more flexible for complex data storage.
2. How does the split() function work in R?
The split() function divides the data into groups based on a factor:
split(data$values, data$group)
It returns a list of subsets for each factor level, which is useful for grouped analysis.
3. What is the difference between data.frame and tibble in R?
tibble is a modern reimagining of data.frame from the tidyverse. It does not convert strings to factors by default, prints cleaner outputs, and handles list-columns gracefully. It’s designed to work seamlessly with dplyr and other tidy tools.
4. How can you optimize performance in R for large datasets?
Use efficient packages like data.table and dplyr, leverage vectorized operations over loops, minimize copying by modifying data in place, and avoid growing objects in loops. Also, consider using compiled code via Rcpp for critical sections.
5. Explain the purpose of the do.call() in R.
do.call() constructs and executes a function call from a name or function and a list of arguments:
do.call("rbind", list(df1, df2))
It’s useful for dynamic function execution when arguments are stored in a list.
6. What are environments in R, and how are they used?
Environments are collections of symbol-value pairs and define the context in which R expressions are evaluated. Every function in R has its own environment, which is crucial for scoping rules and function closures.
7. How do closures work in R?
A closure is a function written by another function that captures and remembers the environment in which it was created. It allows the inner function to access variables from the outer function’s scope even after the outer function has finished executing.
8. How does lazy evaluation work in R?
R uses lazy evaluation for function arguments. This means arguments are only evaluated when they are actually used inside the function body, which can optimize performance and control logic.
9. What is the use of with() and within() functions?
-
with() is used to simplify code by avoiding repeated references to a data object.
-
within() modifies the data and returns a modified copy:
within(df, {new_col <- col1 + col2})
10. How does R handle scope and name masking?
R searches for variables starting from the innermost environment and continues upward. Name masking occurs when an inner environment variable hides another with the same name from an outer environment. This is why understanding lexical scoping is important in R.
11. What is non-standard evaluation (NSE) in R?
NSE allows functions to capture the expression used as an argument rather than its evaluated result. It is used in dplyr functions and is enabled by functions like substitute(), quote(), and eval(). It’s essential for tidy evaluation and writing domain-specific languages.
12. How do you manage packages and dependencies in R projects?
Use renv or packrat to manage package versions and dependencies. These tools create isolated environments that ensure reproducibility. DESCRIPTION and NAMESPACE files help manage dependencies in custom R packages.
13. How to write vectorized functions and why are they important?
Vectorized functions operate on entire vectors at once, making them faster and more memory-efficient than loops:
result <- a + b # Vectorized
Use ifelse(), apply(), or base arithmetic for speed improvements.
14. What is the pipe operator %>% and how does it work?
The pipe operator %>% passes the result of the left-hand side expression to the first argument of the right-hand side function:
data %>% filter(score > 80) %>% summarise(mean_score = mean(score))
It improves readability and is a staple of tidyverse workflows.
15. How do you perform grouped operations in R using dplyr?
Use group_by() followed by summarise() or mutate():
data %>% group_by(department) %>% summarise(avg_salary = mean(salary))
This syntax is powerful for quick and readable data aggregation.
Advanced R Programming Interview Questions and Answers
1. What is metaprogramming in R?
Metaprogramming refers to the practice of writing code that can generate or modify other code. In R, this involves using functions like substitute(), deparse(), and eval(). It enables dynamic code execution, often used in packages for custom DSLs (domain-specific languages) and automation.
2. How does R's memory management system work in detail?
R uses garbage collection to manage memory. Memory is allocated in a heap, and when objects are no longer referenced, the garbage collector frees up space. Use functions like gc(), pryr::mem_used(), or lobstr::obj_size() to inspect memory. Large data operations should be handled with memory-efficient packages like data.table or by chunking data.
3. What is the difference between lexical and dynamic scoping, and which does R use?
R primarily uses lexical scoping, where the value of a variable is looked up based on the environment where the function was defined, not where it was called. This enables the use of closures and predictable variable resolution.
4. How do you use Rcpp to improve performance?
Rcpp allows you to write C++ code that integrates seamlessly with R, improving speed for computationally intensive tasks. Use Rcpp::cppFunction() or create an R package using Rcpp::sourceCpp() for larger projects. This reduces execution time dramatically for loops and simulations.
5. What is lazy loading in R packages?
Lazy loading delays the loading of functions and data until they're actually needed. This is implemented in R packages to save memory and improve initial loading speed. You can enable it in the DESCRIPTION file by setting LazyData: true.
6. Explain the concept of S3, S4, and R6 object-oriented programming systems.
-
S3 is a simple, informal system using generic functions and method dispatch based on class attributes.
-
S4 is more formal, supports multiple inheritance and strict validation.
-
R6 is designed for encapsulated object-oriented programming with reference semantics, useful in web apps and APIs.
7. How do you profile and debug R code?
Use profiling tools like Rprof(), profvis, and lineprof to find bottlenecks. For debugging, functions like browser(), debug(), traceback(), and options(error = recover) help trace issues during runtime.
8. How does parallel computing work in R?
Use the parallel, foreach, and future packages to run computations on multiple cores. Techniques include:
-
Forking (UNIX-based)
-
Multisession
-
MPI (via Rmpi) These can greatly reduce computation time for large simulations or resampling tasks.
9. What is functional programming in R?
Functional programming (FP) in R involves treating functions as first-class objects. You can pass functions as arguments, return them from other functions, and compose them. Libraries like purrr make FP more expressive with functions like map(), reduce(), and compose().
10. What is a promise object in R?
A promise object is created when a function is called but its argument has not yet been evaluated due to lazy evaluation. It’s only evaluated when needed. This supports R's default lazy behavior but can lead to unexpected results if misunderstood.
11. How do you write custom operators in R?
Custom operators use the % syntax. For example:
'%+%' <- function(a, b) paste0(a, b)
"Hello" %+% " World" # Output: "Hello World"
Custom operators are useful for enhancing readability or building DSLs.
12. How do you optimize recursive functions in R?
Use memoization with memoise package to cache results. Alternatively, convert recursion to iteration or use compiled code for performance-critical paths. Recursive functions in R can hit performance limits due to deep call stacks.
13. What are attributes in R, and how are they used?
Attributes store metadata about objects (e.g., names, dimensions, class). Use attributes() to view or attr() to modify them. They allow objects to behave differently in generic functions without altering their core structure.
14. Explain delayed assignment and its uses.
Delayed assignment lets you assign a variable without computing its value immediately using delayedAssign(). It’s useful in package loading and lazy evaluation strategies:
delayedAssign("x", {Sys.time()})
15. What is the use of trace() and untrace()?
trace() lets you insert code into functions for debugging or logging without modifying the original function. untrace() removes the inserted code. Useful in development and diagnostics.
R Programming Interview Questions for Freshers
1. What is R, and what is it used for?
R is a programming language and environment widely used for statistical computing, data analysis, and graphical representation. It's popular in academia and industry for tasks such as machine learning, data mining, and bioinformatics.
2. How do you install and load a package in R?
To install a package:
install.packages("ggplot2")
To load it into your session:
library(ggplot2)
3. What are vectors in R?
Vectors are basic data structures in R that hold elements of the same type (numeric, character, logical, etc.). You can create a vector using the c() function:
vec <- c(1, 2, 3)
4. What is a data frame?
A data frame is a table or 2D structure where each column can contain different types of data (numeric, character, factor, etc.). It’s widely used to store datasets:
df <- data.frame(Name=c("Alice", "Bob"), Age=c(25, 30))
5. What is the difference between = and <- in R?
Both assign values, but <- is the conventional assignment operator in R. = can be used in functions, but is discouraged in global assignments.
6. How do you comment code in R?
Use the # symbol before a line:
# This is a comment
Comments are ignored during code execution.
7. How do you check the structure of an R object?
Use str() to get a compact overview:
str(df)
8. What is the use of the summary() function?
It gives a statistical summary of each variable in a data frame:
summary(df)
Useful for quick data exploration.
9. What is the difference between NA, NaN, and NULL?
-
NA: Missing or undefined data.
-
NaN: Result of undefined mathematical operations.
-
NULL: Represents an empty or nonexistent object.
10. How do you subset data in R?
Use square brackets:
df[1, ] # First row
df[ ,"Name"] # Name column
11. How do you read a CSV file in R?
data <- read.csv("file.csv")
Use read.csv2() for semicolon-separated files.
12. What is the difference between a matrix and data.frame?
-
matrix: All elements must be of the same type.
-
data.frame: Can contain mixed types.
13. What is a factor in R?
A factor is a categorical variable used to represent discrete categories. It stores nominal data efficiently and is useful in statistical modeling.
14. What function is used for sorting in R?
Use sort() for sorting vectors:
sort(c(3, 1, 2))
15. How do you create a sequence in R?
Use seq() or the colon operator:
seq(1, 10, by=2)
1:10
These functions help in generating sequences and indexing.
R Programming Interview Questions for Experienced
1. How do you handle large-scale data processing in R?
Experienced developers use packages like data.table, dplyr, and arrow for efficient memory management and performance. They also implement chunk processing, lazy evaluation, and external database connections (e.g., via DBI) to avoid memory overload.
2. Explain how to build and maintain R packages.
Use devtools, roxygen2, and usethis for package creation. A package should include DESCRIPTION, NAMESPACE, and R/ folders. Use roxygen2 for documentation and testthat for unit testing. CRAN submission requires adherence to strict formatting and code checks.
3. How do you integrate R with other languages like Python or C++?
Use reticulate to integrate Python and Rcpp for C++. This allows you to use external libraries or speed up computation-heavy functions.
4. Describe your experience with the production deployment of R scripts.
Deployment methods include scheduling R scripts via cron, using R Markdown reports, integrating with APIs via plumber, or deploying dashboards through Shiny Server. Containerization using Docker is also common for reproducibility.
5. How do you manage dependencies and environment replication?
Experienced R users use renv or packrat for dependency management. These tools snapshot and restore exact versions of packages used in a project, ensuring reproducibility.
6. What strategies do you use to debug complex R applications?
Advanced debugging involves debug(), traceback(), recover(), and browser(). Logging mechanisms with futile.logger or custom wrappers help track down bugs in production-grade applications.
7. How do you scale R scripts for performance?
Use parallel processing (e.g., parallel, doParallel, future, or foreach), memory-efficient coding patterns, and profiling tools (profvis, Rprof) to identify bottlenecks and optimize loops.
8. Explain the difference between eager and lazy evaluation in function design.
Lazy evaluation delays computation until necessary. Advanced users exploit this for performance or conditional logic. Eager evaluation computes immediately. Understanding when to use each helps design more efficient and adaptable functions.
9. How do you ensure code quality in large R projects?
Use modular code, thorough documentation, linters (lintr), unit tests (testthat), version control (Git), and CI/CD pipelines. Adhering to tidyverse or base R style guides also promotes maintainability.
10. What’s the role of S3/S4/R6 in your R development?
S3 is used for simple polymorphism. S4 adds formality with defined classes and validation. R6 offers encapsulated OOP with mutable state, ideal for object-heavy tasks like GUI or API development.
11. Describe your use of R for time series forecasting.
Use packages like forecast, prophet, or fable. Key steps include data preprocessing, decomposition, model selection (ARIMA, ETS), and validation using rolling forecasts or cross-validation.
12. How do you ensure your R applications are secure?
Avoid eval/parse on user input, sanitize data inputs, restrict file access, and limit permissions. When building Shiny apps, implement authentication and audit logging.
13. How do you optimize machine learning workflows in R?
Use caret, mlr3, or tidymodels for pipelining. Optimize performance with parallel processing, cross-validation, and hyperparameter tuning (e.g., tune() from tidymodels).
14. How do you document your work for reproducibility?
Use RMarkdown. Rproj files, Git, and environments (renv) to track code and dependencies. Document assumptions, data sources, preprocessing steps, and rationale behind modeling decisions.
15. Explain a time when you used R for a complex business problem.
Examples may include churn prediction, customer segmentation using k-means or hierarchical clustering, marketing attribution using logistic regression, or financial modeling via time series analysis. Key steps include exploratory analysis, feature engineering, modeling, and result communication.
Career Opportunities and Job Roles in R Programming
With the increasing growth of data-centric roles in 2025, R programmers are highly sought after across industries like healthcare, finance, retail, government, and research. Mastering R opens up diverse career paths, including but not limited to:
-
Data Analyst – Analyze structured and unstructured data, visualize trends, and support business decisions.
-
Data Scientist – Build predictive models, perform machine learning, and work with big data using R alongside Python.
-
Statistician – Use R to conduct complex statistical analyses in domains like epidemiology, marketing, and economics.
-
Business Intelligence Analyst – Design dashboards and extract insights using R packages like shiny, ggplot2, and plotly.
-
Bioinformatician – In bio-sciences, R is extensively used to analyze genomic data and clinical trials.
-
Quantitative Analyst – In finance, use R for modeling risk, portfolio optimization, and market simulations.
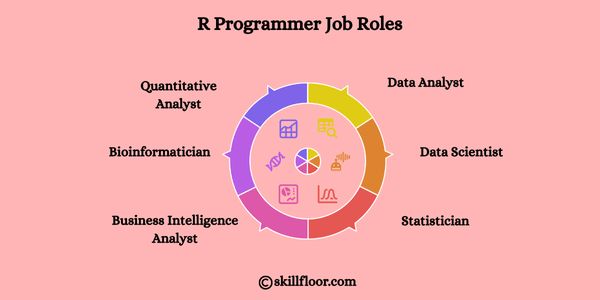
These roles often require a blend of programming skills, domain knowledge, and statistical reasoning. Learning R not only boosts employability but also future-proofs your career in the ever-evolving data science industry.
R programming remains a cornerstone of modern data analytics, statistical modeling, and machine learning. In 2025, its influence spans across domains like finance, healthcare, government, academia, and tech startups, driving evidence-based decisions through robust analytics. Whether you’re an aspiring data analyst or an experienced data scientist, preparing for R interviews can be your stepping stone to new and lucrative opportunities.
Mastering R not only helps you ace interviews but also opens doors to a wide range of job roles that require a deep understanding of data. From building models to developing interactive dashboards, the possibilities are vast and rewarding. With its open-source nature, active community, and wide range of packages, R will continue to thrive as an essential skill in the data-driven economy.
If you're serious about advancing your career in data science or analytics, now is the time to double down on R. Review these questions regularly, apply the concepts in real projects, and stay updated with the latest trends to remain competitive and confident in your career journey.


