


Let’s Explore the Types of Data Science
Discover key types of data science, including descriptive, diagnostic, predictive, and prescriptive analytics, and how each drives data-driven decisions.

Have you ever wondered how your favorite apps can determine your exact needs? Behind the scenes, data helps with everything from the ideal product to a movie recommendation to a timely weather notice. Experts analyze trends in our everyday decisions to enhance services, save time, and simplify life, providing you with beneficial outcomes at the precise moment you need them.
Data science is now widely recognized as a component of good decisions. From health care to retail, it helps businesses better plan, establish fair rates, and assist customers. People accept the outcomes because they are based on the facts, not opinion. We become more confident in the brands we trust and the technologies we use when decisions are supported by solid evidence.
What is Data Science?
Utilizing data and statistics to comprehend the world around us is known as data science. It helps in pattern recognition, question answering, and improved decision making. Data science enhances the intelligence and usefulness of commonplace technologies in straightforward ways, from shopping applications to weather predictions.
Data science skills, such as arranging data, seeing patterns, and creating lucid reports, are used to deal with data. With these abilities, jumbled data may be transformed into insightful knowledge. These talents are now beneficial for practically every profession, whether you're preparing for the future or addressing challenges at work.


Why Data Science Matters in Today’s World
Every day, data science helps us in making better decisions. It transforms numbers into actionable solutions for anything from buying to lifesaving. For this reason, it is an essential talent in the modern world.
-
Smarter Business Decisions: Data is used by businesses to better understand their clients and make plans. Finding practical patterns that help in business expansion and improve customer service is something that a quality data science course teaches.
-
Healthcare Improvements: Data is used by doctors to monitor patient health and anticipate hazards. It helps in identifying the first indications of disease and selecting the most effective therapies to enhance care and preserve lives.
-
Better Customer Service: Many companies utilize data to provide prompt, amiable assistance. By understanding people's needs, they can provide prompt responses, more seamless interactions, and assistance that feels helpful and personable.
-
Improved Education Systems: Data is used by schools to determine how best to teach kids. For each student to receive the assistance they require, it assists teachers in identifying areas of learning deficiency and experimenting with more effective teaching strategies.
-
Safer Cities and Roads: Data is used by city planners to build roadways, lower traffic, and increase safety. It aids in determining the most effective times and locations for daily modifications that safeguard individuals.
-
Smarter Shopping Experiences: Businesses keep note of what customers want to purchase in order to recommend better items. This helps companies maintain inventory of popular products while also making purchasing more enjoyable and easier.
Exploring the Diverse Types of Data Science
1. Descriptive Data Science
Descriptive data science uses historical data to help us comprehend what has previously occurred. It transforms unstructured data into comprehensible summaries, such as reports or charts, which facilitates the identification of patterns or trends across time.
How It Works
Past data is gathered, carefully arranged, and displayed using simple graphics like tables or graphs. People don't have to sift through jumbled details to view outcomes, compare items, or follow improvements because of this.
Tools Used: Excel, Google Sheets, Tableau, Power BI, SQL.
2. Diagnostic Data Science
By examining historical data in greater detail, diagnostic data science helps explain why something happened. It assists people in comprehending issues and making better decisions in the future by identifying connections, trends, or modifications that led to a result.
How It Works
It makes comparisons between several data points to identify what changed or went wrong. Examining patterns, distinctions, or surprising outcomes attentively enables individuals to determine the actual root of a problem or abrupt shift.
Tools Used: SQL, Python (with pandas or matplotlib), R.
3. Predictive Data Science
By estimating future outcomes based on historical data, predictive data science helps address what could happen next. It assists individuals in becoming ready for upcoming events, such as sales, trends, or consumer behavior.
How It Works
It creates basic models that can make educated estimates about the future by examining trends in historical data. These models assist people in making better daily decisions, preventing issues, and planning.
Tools Used: Python (scikit-learn), TensorFlow, R, Spark, Google Cloud Tools.
4. Prescriptive Data Science
Prescriptive data science assists in determining the next course of action. Beyond merely illustrating potential outcomes, it offers astute recommendations for resolving issues or taking the best course of action.
How It Works
It analyzes historical data, makes predictions about potential outcomes, and then provides explicit guidance on what to do. In order to enable smarter judgments, a solid data science foundation is essential.


Tools Used: Excel Solver, Python, R, Power BI, Google OR-Tools.
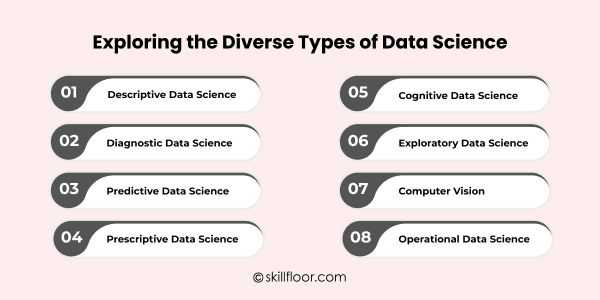
5. Cognitive Data Science
The goal of cognitive data science is to educate robots to do activities that often require human thought, such as language comprehension, image recognition, and basic decision-making. It contributes to the development of more intelligent and intuitive technologies.
How It Works
Similar to how humans learn by often seeing or hearing things, it employs vast collections of samples to teach robots how to react, communicate, or recognize patterns. This increases the usefulness of technology in commonplace products like picture applications and voice assistants.
Tools Used: Python, TensorFlow Lite, Spacy, Google Teachable Machine.
6. Exploratory Data Science
You may learn from data without searching for a definitive solution by using exploratory data science. Before choosing where to go further or what questions to ask next, it's similar to asking, "What's interesting here?"
How It Works
It searches for trends, clusters, or surprises in raw data. It is frequently used early in a project to get insight from the data, even before establishing a specific objective or course of action.
Tools Used: Excel, Python, RStudio, Power BI, Jupyter Notebook
Data science's computer vision field helps in machines' ability to see and comprehend pictures or movies. It is utilized in photo tagging, facial recognition, and even shelf inspection.
How It Works
After dividing images or videos into little segments, it searches for patterns, colors, or forms. Like our eyes and brains work together, it can recognize people, objects, or even activities with experience.
Tools Used: Google Teachable Machine, OpenCV, TensorFlow Lite, PictoBlox.
8. Operational Data Science
Real-time assistance for daily tasks is provided by operational data science. By integrating new data to make informed decisions quickly throughout the day, it helps companies and services function smoothly.
How It Works
Using real-time data, like inventory, traffic, or orders, it instantly changes systems. People can keep track of things, quickly resolve minor issues, and maintain order and clarity.
Tools Used: Apache, MLflow, Apache Spark, Apache Flink.
The Stages of the Data Science Process Explained
1. Understanding the Problem
The appropriate question must be asked before any work is done. Are we attempting to address a delay, increase revenue, or enhance service? A well-defined objective helps in guiding the effort from the outset.
The data science process starts with this stage. You have to know where you're going before you pack your luggage, just as when you plan a trip. Even rich data cannot help you identify the proper answer if the problem is not well defined.
2. Collecting the Data
The following stage is to collect the data when the question is understood. Websites, forms, machinery, or historical documents might all provide this. Having sufficient valuable facts enables one to clearly and truly understand issues.
This stage is comparable to gathering jigsaw pieces in the data science method. The overall image will be better if the data is more precise and comprehensive. Having enough quality parts to work with is the aim.
3. Cleaning the Data
Missing values, unnecessary spaces, or incorrect entries are common errors in raw data. Cleaning is a significant portion of the task because of. It aids in making things understandable and functional.
This phase is made quicker and easier with a competent data cleaning tool. Errors are eliminated, data is sorted, and organization is maintained. The secret to obtaining truthful and beneficial findings is clean data.
4. Exploring the Data
It's time to investigate now that we have clean data. Summaries, graphs, and charts are helpful tools for illustrating data. You may discover trends, patterns, or even unexpected revelations.
This is an enjoyable and imaginative step in the data science process. When you meet someone new and learn about their narrative through figures and graphics, you get a sense of the data.
5. Building the Model
Now that the data makes sense, you can utilize it to create something beneficial. This might be a straightforward formula or a clever instrument that aids in future decisions or estimates.
This stage transforms data into action in the data science process. It's about figuring out how to apply what you've studied to solve practical issues and provide useful outcomes that others can trust.
6. Sharing the Results
The moment has come to share the narrative after all the effort. Others can see the findings and how they benefit from them thanks to simple dashboards, concise reports, or clear visualizations.
Finally, the data science process ends with a well-written explanation. It simplifies challenging work and makes it helpful, ensuring that everyone can trust the outcomes.
Tools and Technologies Used in Data Science
-
Excel: Excel is an easy tool that many people use to arrange, compute, and examine data. It is excellent for short tasks and preliminary data preparation since it allows you to construct tables, charts, and summaries.
-
Google Sheets: Google Sheets is an online tool that functions similarly to Excel. Teams who need to update or review data together from any location will find it ideal because it enables real-time sharing and collaboration.
-
SQL (Structured Query Language): SQL facilitates the retrieval of certain data from large databases. Large volumes of data are sorted, searched, and filtered to provide you with the precise information you want.
-
Python: Python is an easy-to-learn language for working with and analyzing data. It aids in information cleansing, sorting, and even the creation of basic tools for identifying patterns and trends.
-
R: R is designed for those who deal closely with charts and figures. It's excellent for identifying trends and creating graphs that simplify data interpretation and dissemination.
-
Power BI: Raw data is transformed into visually appealing dashboards and easily readable reports with Power BI. Business teams who wish to monitor performance, goals, or progress in real time will find it useful.
-
Tableau: Tableau is used to create dashboards and interactive graphics. It assists in transforming statistics into comprehensible images so that others may comprehend findings without having to go through data rows.
-
Google Looker Studio: Google Looker Studio creates easy-to-share reports by integrating with programs like Google Sheets and Analytics. It's a useful tool for making dashboards and visualizations without knowing how to code.
-
Jupyter Notebook: Using Jupyter Notebook, you may write and execute code in addition to notes and images. It's excellent for organizing data work, particularly when you need to precisely describe your procedures.
-
Microsoft Power Query: Before analysis, data is cleaned and prepared using Power Query. It's integrated into Excel and saves time by automating processes like data merging, mistake correction, and duplication removal.
Everyday technologies are becoming smarter, services are becoming quicker, and choices are becoming more transparent thanks to data science. Data is useful behind the scenes, whether you're using it to check the weather, purchase online, or get better care at the doctor's office. It transforms common knowledge into something valuable and significant, which is what gives it its immense power. It equips people to perform more efficiently rather than more laboriously by helping them comprehend historical patterns and make plans for the future. Understanding data is becoming more and more essential as more communities and companies employ these abilities. Understanding the fundamentals of data, its applications, and the technologies involved is no longer reserved for specialists; it is now a wise move for everyone looking to stay current and perform better.