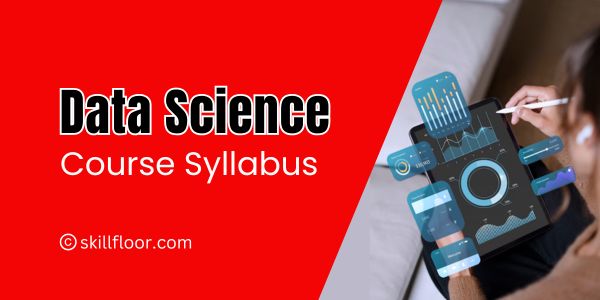
Data Science Course Syllabus
Explore the Data Science course syllabus covering Python, statistics, machine learning, data visualization, and real-world projects.
If you’ve ever wondered how companies predict trends, personalize recommendations, or even make smarter decisions using data, you’ve already brushed up against the power of data science. When I decided to step into the world of data science, the first question I had was, Where do I start? The answer, of course, lies in finding a well-structured course syllabus. A comprehensive syllabus is like a roadmap—it gives you direction, clarity, and a clear sense of what you’ll achieve by the end of the journey.
Why Is a Data Science Course Syllabus Important?
When I first started looking into data science courses, I noticed that not all syllabi are created equal. Some were too confused, while others were so dominant that they felt impossible to follow. A well-designed syllabus does three important things:
-
It sets the foundation for learning.
-
It ensures all the necessary topics are covered.
-
It organizes the learning experience into manageable chunks.
A well-rounded data science course syllabus ensures that you develop both technical and practical skills, which are essential for succeeding in this constantly changing sector.
Who Is This Course For?
Let me start by saying that data science isn’t just for programmers or tech enthusiasts. The beauty of this field lies in its interdisciplinary nature, making it accessible to anyone with curiosity and the willingness to learn.
This course syllabus is ideal for:
-
Beginners with little to no experience in data science.
-
Professionals looking to transition into data science from other fields.
-
Students aiming to build a career in data science.
-
Intermediate learners who want to deepen their expertise in machine learning and AI.
When I started, I fell somewhere between a beginner and a professional looking for a transition. Trust me, with the right resources, anyone can start their journey.
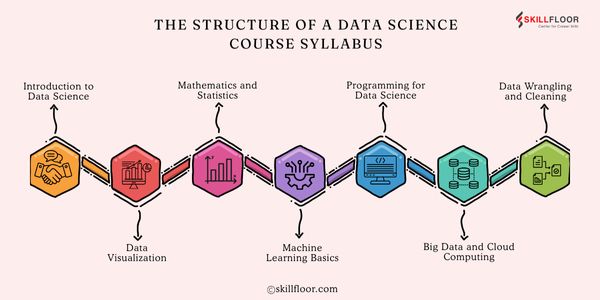
The Structure of a Data Science Course Syllabus
Most courses are divided into modules or sections, and I’ll break them down for you here. These are the areas you can expect to cover.
1. Introduction to Data Science
This is where the journey begins. For me, this module was all about understanding the "what" and "why" of data science. You’ll cover:
-
The role of data science in solving real-world problems.
-
Key components: data collection, processing, analysis, and visualization.
-
An introduction to tools like Python, R, and SQL.
The first module was my wake-up call—it made me realize just how broad and impactful data science is.
2. Mathematics and Statistics
Mathematics and statistics are crucial for understanding and working with data. Here's a simplified breakdown:
1. Basic Statistics
Statistics helps summarize and understand data.
-
Mean: The average of all values.
-
Median: The middle value when data is sorted.
-
Variance/Standard Deviation: Shows how spread out the data is from the average.
2. Probability
Probability helps calculate the chance of an event happening.
-
Random Variables: Values that come from chance (e.g., coin flips).
-
Distributions: Show how likely each outcome is (e.g., normal distribution).
-
Bayes’ Theorem: Updates probabilities based on new information (e.g., predicting disease risk based on test results).
3. Linear Algebra
Linear algebra is used for data manipulation and machine learning.
-
Vectors: Lists of numbers representing data points.
-
Matrices: Grids of numbers used to organize and process large datasets.
-
Eigenvalues/Eigenvectors: Help with data transformations in machine learning.
4. Calculus
Calculus helps improve machine learning models by finding the best settings for them.
-
Derivatives: Show how things change and help in making improvements.
-
Integrals: Help calculate areas under curves and in probability models.
Why It Matters
These math concepts help you analyze, predict, and make decisions with data. Understanding them is key to building effective data science models.
3. Programming for Data Science
This part of the course teaches you how to write code and use programming tools to work with data. If you're new to coding, don't worry—it might seem tricky at first, but with practice, you'll get better. Here's a breakdown of what you'll learn:
1. Python Basics
Python is a programming language used a lot in data science. You'll start by learning:
-
Syntax: The rules for writing code that computers can understand.
-
Loops: Repeating tasks. For example, going through a list of numbers and doing something with each one.
-
Conditionals: Making decisions in your code. For example, if it’s raining, print "Bring an umbrella".
-
Functions: A way to organize your code into blocks that do specific tasks. This helps you reuse code instead of writing the same thing over and over.
2. Libraries
In data science, we use special tools, called libraries, to make tasks easier. You'll learn about:
-
Pandas: Helps you work with data, like sorting or finding the average.
-
NumPy: Helps you do math with large sets of numbers quickly.
-
Matplotlib: Helps you create graphs and charts to show your data.
3. R Basics
R is another programming language used in data science, especially for analyzing and visualizing data. In this section, you'll learn how to:
-
Use R to create charts and analyze numbers from data.
4. Hands-On Practice
This module is all about practice—you'll write code, try out different tasks, and work with real data. You'll get experience doing things like:
-
Cleaning and organizing messy data.
-
Making simple models to learn from the data.
-
Creating charts to show your findings.
Why It's Important
Programming is a key skill in data science. Without it, you can't work with data, analyze it, or make useful predictions. This module helps you get comfortable with coding, so you can start using data to solve problems.
4. Data Wrangling and Cleaning
In data science, raw data is often messy, and we need to clean it before using it for analysis. This part of the course teaches you how to prepare the data for accurate insights.
1. Handling Missing Values
Sometimes data is missing, and we need to fix it:
-
Remove: Delete rows or columns with too many missing values.
-
Fill: Replace missing values with averages or estimates.
2. Identifying Outliers
Outliers are data points that don’t fit with the rest of the data. They can mess up your analysis:
-
What is an Outlier? Example: A test score of 1000 in a class where all other scores are below 100.
-
How to Handle: Identify outliers using statistics or charts, then decide whether to remove or adjust them.
3. Data Transformation and Normalization
We change data to make it easier to use:
-
Transformation: Change the format of data, like converting all dates to the same style.
-
Normalization: Adjust values so they are on a similar scale, like making all income data fit between 0 and 1 for easy comparison.
Why It Matters
Data cleaning might feel boring, but it’s essential. If your data isn’t clean, your results won’t be accurate. Clean data is the foundation of reliable analysis and decision-making.
5. Data Visualization
Data visualization is about turning numbers into easy-to-understand pictures, like charts and graphs, to tell a story. This part of the course helps you present data clearly and effectively.
1. Creating Charts and Graphs
You’ll learn to turn data into visuals using tools like:
-
Matplotlib and Seaborn (Python libraries) for making graphs.
-
Tableau for creating interactive dashboards.
2. Designing Dashboards
Dashboards are a collection of charts that give a clear overview of important data. You’ll learn how to design easy-to-read dashboards that highlight key insights.
3. Communicating Findings
The goal of visualization is to make your findings clear:
-
Use visuals to tell a simple, focused story.
-
Make sure your charts are easy to understand for your audience.
Why It Matters
Good data visualization helps people quickly understand complex information. It’s not just about making things look good, but about making data clear and impactful for decision-making.
6. Machine Learning Basics
Machine learning teaches computers to learn from data and make decisions without explicit programming. Here’s a quick look at what you’ll learn:
1. Supervised Learning
-
Regression: Predict numbers (e.g., house prices).
-
Classification: Predict categories (e.g., spam or not spam emails).
2. Unsupervised Learning
-
Clustering: Group similar things (e.g., customers with similar buying habits).
-
Dimensionality Reduction: Simplify complex data (e.g., turning many features into a simple chart).
3. Key Algorithms
-
Linear Regression: Predicts values by drawing a line through data.
-
Decision Trees: Makes decisions step-by-step based on data features.
-
K-means Clustering: Groups similar data points.
Why It’s Important
Machine learning helps solve real-world problems by predicting, analyzing, and finding patterns in data.
Real-Life Examples
-
Healthcare: Predicting diseases.
-
Retail: Recommending products.
-
Finance: Detecting fraud.
-
Entertainment: Suggesting movies on Netflix.
This module gives you the basics to start building smart systems that can solve problems and make decisions.
7. Big Data and Cloud Computing
If you want to work in data science, you need to understand how to handle big data—huge datasets that can’t be processed easily with normal tools. This module covers:
1. Big Data Tools
-
Hadoop and Spark: These tools help process and analyze large datasets quickly and efficiently.
2. Cloud Platforms
-
AWS and Google Cloud: These platforms provide storage and computing power to manage and work with big data remotely.
Though this was a more technical module, it helped me understand how massive datasets are handled in the real world, especially in industries that deal with a lot of data every day.
Capstone Project at Skillfloor
The Capstone Project at Skillfloor is the final challenge of the data science course. It allows you to bring together everything you've learned throughout the program. Here's what you can expect:
1. Work on a Real-World Dataset
You’ll work with an actual dataset, just as you would in a real-world data science job.
2. Apply Your Skills
This is where you apply all the key skills you've acquired:
-
Data cleaning: Preparing your dataset for analysis.
-
Data visualization: Presenting your data in clear and insightful graphs.
-
Machine learning: Applying algorithms to make predictions or uncover patterns.
3. Present Your Findings
After working through the data, you'll present your results in a professional and clear manner, showcasing your ability to communicate insights effectively.
Learning Outcomes
By the end of the course, here’s what you can expect to achieve:
-
The ability to analyze and interpret data.
-
Hands-on experience with tools like Python, R, SQL, and Tableau.
-
A solid understanding of machine learning concepts.
-
Practical knowledge of big data and cloud platforms.
-
A portfolio of projects to showcase to potential employers.
For me, these outcomes weren’t just theoretical—I could see myself applying these skills in real-world scenarios.
Tools and Technologies Covered
Here’s a quick list of the tools you’ll likely learn to use:
-
Programming Languages: Python, R, and SQL.
-
Libraries: Pandas, NumPy, Matplotlib, Seaborn, Scikit-learn.
-
Visualization Tools: Tableau, Power BI.
-
Big Data Tools: Hadoop, Spark.
-
Cloud Platforms: AWS, Google Cloud.
Having hands-on experience with these tools made me feel industry-ready.
Prerequisites
One of the things I appreciated most about my course was its accessibility. While some prior knowledge of programming or math is helpful, it’s not always required. If you’re a beginner, don’t let this scare you—most courses start from scratch and build up gradually.
Tips for Aspiring Students
If I could go back and give myself advice, here’s what I’d say:
-
Practice regularly, especially coding and problem-solving.
-
Don’t be afraid to ask questions or seek help.
-
Work on real-world datasets—they’re messy but invaluable for learning.
-
Join online communities and forums for support and networking.
These tips kept me motivated and on track throughout the course.
Ready to Start Your Journey?
If you’ve made it this far, you’re probably as excited about data science as I was when I started. A well-structured course syllabus can make all the difference in your learning experience. Whether you’re a beginner or looking to advance your skills, having a clear roadmap will help you achieve your goals.
Are you ready to dive in? Explore a course syllabus today and start your journey toward becoming a data scientist. Believe me, it’s a decision you won’t regret.


