


Data Analyst Interview Questions and Answers: A Complete Guide
Prepare for your 2025 data analyst interview with 30 key questions, detailed answers, SQL tips, and data visualization techniques.

Data is present everywhere in the modern world. From social media interactions and online shopping behavior to financial transactions and healthcare records, organizations generate massive amounts of data every second. However, in order to derive significant insights, raw data must be analyzed and interpreted; otherwise, it is of little use. This is where data analytics comes in. The role of a data analyst is crucial in this ecosystem. Data analysts act as a bridge between raw data and decision-makers, using tools, statistical techniques, and visualization methods to convert complex data into clear and actionable insights. As businesses increasingly rely on data-driven strategies, the demand for skilled data analysts has grown exponentially.
For anyone preparing for a data analyst interview, it’s essential to understand both the technical skills required—like SQL, Excel, Python, and visualization tools—and the ability to interpret and communicate insights effectively. This guide covers the most commonly asked data analyst interview questions, along with detailed answers and examples, to help you prepare thoroughly and confidently.
What is Data Analytics?
Data analytics is the process of examining raw data to extract useful insights that inform decision-making. It involves using various tools, techniques, and methodologies to clean, process, visualize, and analyze data.
Key Components of Data Analytics


-
Descriptive Analytics: Focuses on understanding what has happened. For example, “What was our sales revenue last quarter?”
-
Diagnostic Analytics: Investigates why something happened. For example, “Why did sales drop in the last quarter?”
-
Predictive Analytics: Uses historical data to forecast future trends. For example, “What will be next quarter’s sales revenue?”
-
Prescriptive Analytics: Recommends actions based on data insights. For example, “Which marketing strategy should we adopt to increase revenue?”
A data analyst’s role is to bridge the gap between raw data and actionable insights, using tools such as SQL, Excel, Python, R, Tableau, Power BI, and others.
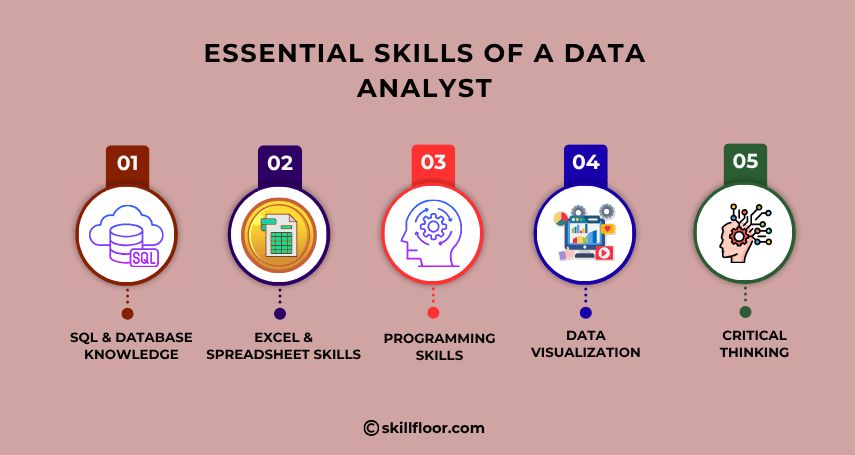
Essential Skills of a Data Analyst
Before we dive into interview questions, let’s highlight the key skills employers look for in data analysts:
-
SQL & Database Knowledge: Ability to query and manipulate data efficiently.
-
Excel & Spreadsheet Skills: Data cleaning, pivot tables, and formula-based analysis.
-
Statistical Knowledge: Hypothesis testing, regression, and probability analysis.
-
Programming Skills: Python or R for data analysis, automation, and visualization.
-
Data Visualization: Using Tableau, Power BI, or matplotlib/seaborn for clear communication.
-
Critical Thinking: Ability to interpret data, identify trends, and provide actionable insights.
Top 30 Data Analyst Interview Questions and Answers
1. What is the role of a data analyst?
A data analyst’s primary role is to collect, process, and interpret data to support business decisions. They design dashboards, generate reports, perform data cleaning, and perform statistical analysis to reveal patterns and trends. For instance, a data analyst in e-commerce might analyze customer purchase behavior to optimize product recommendations.
2. What are the key skills of a data analyst?
The most important skills include:
-
SQL for data extraction
-
Excel for data cleaning and pivot tables
-
Python or R for advanced analysis
-
Data visualization using Tableau or Power BI
-
Statistical analysis and hypothesis testing
-
Effective communication to convey insights
Employers look for candidates who can combine technical skills with business understanding to generate actionable insights.
3. What is the difference between data mining and data analysis?
-
Data Mining: Extracting patterns from large datasets using algorithms and statistical methods. Example: identifying customer segments based on purchasing behavior.

-
Data Analysis: Interpreting processed data to derive insights. Example: calculating the average revenue per customer to guide marketing campaigns.


While data mining is about discovery, data analysis focuses on interpretation and decision-making.
4. Explain the difference between structured and unstructured data?
-
Structured Data: Organized in rows and columns, such as SQL databases or Excel spreadsheets. Easy to query and analyze.
-
Unstructured Data: Does not have a predefined format, such as emails, social media posts, images, and videos. Requires additional processing to analyze.
For example, analyzing customer feedback from surveys is structured, while analyzing sentiments from tweets requires unstructured data processing.
5. What is ETL in data analytics?
ETL stands for Extract, Transform, Load:
-
Extract: Collect data from multiple sources like databases, APIs, or CSV files.
-
Transform: Clean, standardize, and format data for analysis.
-
Load: Store processed data in a warehouse or database for analysis.
ETL pipelines ensure data integrity, consistency, and reliability for decision-making.
6. What are the steps involved in the data analysis process?
-
Define the problem: Understand the business question or objective.
-
Collect data: Gather relevant datasets from multiple sources.
-
Clean data: Handle missing values, duplicates, and inconsistencies.
-
Explore data: Use descriptive statistics and visualizations to understand trends.
-
Analyze data: Apply statistical or predictive models to extract insights.
-
Interpret results: Draw conclusions that inform business decisions.
-
Communicate findings: Present insights via dashboards, reports, or presentations.
7. What is a pivot table, and how is it useful?
A pivot table is a data summarization tool in Excel or BI platforms. It allows you to aggregate data, calculate metrics, and visualize trends quickly. For example, a pivot table can summarize sales by region, product, or customer segment. It is especially useful for quick reporting and decision-making.
8. What is normalization in databases?
Normalization is organizing data in a database to reduce redundancy and maintain integrity.
-
1NF (First Normal Form): Eliminates repeating groups.
-
2NF (Second Normal Form): Removes partial dependencies.
-
3NF (Third Normal Form): Removes transitive dependencies.
Normalization ensures efficient storage and minimizes anomalies during data operations.
9. Explain the difference between inner join, left join, right join, and full join.
-
Inner Join: Returns only records that match in both tables.
-
Left Join: Returns all records from the left table and matches from the right table.
-
Right Join: Returns all records from the right table and matches from the left table.
-
Full Join: Returns all records from both tables, filling gaps with nulls.
Understanding joins is critical for combining data across multiple tables effectively.
10. What is data cleaning?
Data cleaning is the process of removing errors or inconsistencies in data. Key steps include:
-
Removing duplicates
-
Handling missing values
-
Correcting incorrect formats
-
Identifying and handling outliers
Clean data ensures accurate analysis and meaningful results.
11. What is A/B testing, and why is it used?
A/B testing is a controlled experiment comparing two versions of a product or process to see which performs better. Example: testing two versions of a landing page to measure conversion rates. It helps businesses make data-driven decisions and optimize performance.
12. What is correlation, and how is it different from causation?
-
Correlation: Measures the relationship between two variables. Positive correlation means variables move together; negative correlation means they move inversely.
-
Causation: Indicates one variable directly affects the other.
Important: Correlation does not imply causation. For instance, ice cream sales may correlate with drowning incidents (both increase in summer), but one does not cause the other.
13. What is a histogram?
A histogram is a bar chart that represents the frequency distribution of numerical data. It divides data into intervals (bins) and counts occurrences. Histograms are useful for visualizing data distribution, skewness, and variability.
14. What is the difference between supervised and unsupervised learning?
-
Supervised Learning: Uses labeled data to predict outcomes. Example: predicting sales revenue based on historical data.
-
Unsupervised Learning: Finds patterns in unlabeled data. Example: clustering customers based on purchasing behavior.
Data analysts may leverage these techniques for segmentation, forecasting, or recommendation systems.
15. Explain the term outlier. How can you handle it?
An outlier is a data point significantly different from the majority of observations. Handling outliers includes:
-
Removing erroneous data points
-
Transforming data (e.g., log transformation)
-
Using robust statistics (median instead of mean)
Example: A customer purchase of $1,000,000 in a dataset where most purchases are below $5,000 is likely an outlier.
16. What are KPIs, and why are they important?
Key Performance Indicators (KPIs) measure progress toward specific business goals. Examples:
-
Revenue growth
-
Customer retention rate
-
Average transaction value
KPIs help track performance and guide strategic decisions by focusing on metrics that matter.
17. Explain the difference between mean, median, and mode?
-
Mean: Average of all values.
-
Median: Middle value in sorted data.
-
Mode: Most frequent value.
For skewed data, the median is preferred over the mean to avoid distortion from outliers.
18. What is a data warehouse?
A data warehouse is a centralized repository storing integrated data from multiple sources. It supports analytics, reporting, and decision-making. Examples include Amazon Redshift, Snowflake, and Google BigQuery.
Data warehouses are optimized for querying large datasets efficiently.
19. What is the difference between OLTP and OLAP?
-
OLTP (Online Transaction Processing): Optimized for day-to-day operations, e.g., processing orders.
-
OLAP (Online Analytical Processing): Optimized for analytical queries and reporting.
OLAP systems are used in dashboards and business intelligence, while OLTP systems handle transactions in real time.
20. How would you handle missing data?
-
Remove rows with missing values if the dataset is large.
-
Fill missing values with mean, median, or mode.
-
Predict missing values using regression or machine learning.
-
Flag missing data for further investigation.
Handling missing data appropriately prevents biased results in analysis.
21. What is data visualization, and why is it important?
Data visualization represents information graphically through charts, graphs, or dashboards. It helps stakeholders quickly understand trends, patterns, and anomalies without sifting through raw data. Tools like Tableau, Power BI, or Python libraries (matplotlib, seaborn) are widely used.
22. What is a scatter plot?
A scatter plot shows the relationship between two continuous variables, with each point representing an observation. Scatter plots help identify correlations, clusters, and potential outliers. For example, plotting advertising spend versus sales revenue can reveal the relationship between marketing investment and sales.
23. What are the different types of data analytics?
-
Descriptive Analytics: What happened?
-
Diagnostic Analytics: Why did it happen?
-
Predictive Analytics: What is likely to happen?
-
Prescriptive Analytics: What actions should be taken?
A well-rounded data analyst should be able to perform all four types depending on business needs.
24. What is SQL, and why is it important for a data analyst?
SQL (Structured Query Language) is used to interact with relational databases. Data analysts use SQL to:
-
Extract and filter data
-
Join multiple tables
-
Aggregate and summarize data
SQL skills are fundamental for working with large datasets efficiently.
25. Explain the difference between INNER JOIN and CROSS JOIN.
-
INNER JOIN: Returns only rows that satisfy the join condition.
-
CROSS JOIN: Returns the Cartesian product of two tables, generating all possible combinations.
CROSS JOIN is rarely used but can be useful for combinatorial analysis.
26. How would you explain data trends to a non-technical stakeholder?
-
Use simple, non-technical language
-
Leverage visualizations like charts and dashboards
-
Highlight actionable insights rather than raw numbers
-
Provide context and real-world implications
Clear communication is as important as technical analysis in driving business decisions.
27. What is a box plot?
A box plot (or whisker plot) visualizes the distribution of data based on minimum, first quartile (Q1), median, third quartile (Q3), and maximum. Outliers are displayed as points outside the whiskers. Box plots are useful for detecting skewness and variability.
28. What is hypothesis testing?
Hypothesis testing is a statistical method to validate assumptions about a dataset:
-
Null Hypothesis (H0): Default assumption.
-
Alternative Hypothesis (H1): Contradicts H0.
Common tests include t-tests, chi-square tests, and ANOVA, which help determine statistical significance.
29. What are some common challenges faced by data analysts?
-
Poor data quality or incomplete datasets
-
Integrating data from multiple sources
-
Handling large volumes of data efficiently
-
Communicating complex findings to non-technical stakeholders
-
Keeping up with evolving tools and technologies
Strong problem-solving skills are necessary to overcome these challenges.
30. How do you prioritize tasks as a data analyst?
Data analysts often juggle multiple projects. Prioritization involves:
-
Evaluating business impact
-
Estimating effort and resources
-
Communicating with stakeholders
-
Focusing on high-value tasks first
Effective prioritization ensures the timely delivery of actionable insights.
Data analytics is at the heart of modern business decision-making, and data analysts play a crucial role in transforming raw data into actionable insights. Preparing for an interview requires a solid understanding of technical skills like SQL, Excel, Python, and data visualization, along with the ability to interpret and communicate findings clearly. By mastering common interview questions and practicing real-world scenarios, candidates can demonstrate both analytical expertise and business acumen. With thorough preparation and confidence, aspiring data analysts can excel in interviews and secure roles that allow them to drive meaningful impact through data.